Free Statistics
of Irreproducible Research!
Description of Statistical Computation | |||||||||||||||||||||||||||||||||||||||
|---|---|---|---|---|---|---|---|---|---|---|---|---|---|---|---|---|---|---|---|---|---|---|---|---|---|---|---|---|---|---|---|---|---|---|---|---|---|---|---|
| Author's title | |||||||||||||||||||||||||||||||||||||||
| Author | *Unverified author* | ||||||||||||||||||||||||||||||||||||||
| R Software Module | rwasp_fitdistrcauchy.wasp | ||||||||||||||||||||||||||||||||||||||
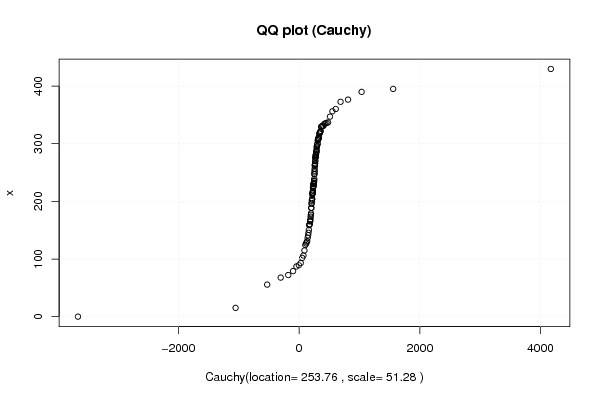
| Title produced by software | Maximum-likelihood Fitting - Cauchy Distribution | ||||||||||||||||||||||||||||||||||||||
| Date of computation | Tue, 06 Apr 2010 10:46:52 +0000 | ||||||||||||||||||||||||||||||||||||||
| Cite this page as follows | Statistical Computations at FreeStatistics.org, Office for Research Development and Education, URL https://freestatistics.org/blog/index.php?v=date/2010/Apr/06/t12705508633hk9nugje51i1db.htm/, Retrieved Thu, 25 Apr 2024 04:32:18 +0000 | ||||||||||||||||||||||||||||||||||||||
| Statistical Computations at FreeStatistics.org, Office for Research Development and Education, URL https://freestatistics.org/blog/index.php?pk=74610, Retrieved Thu, 25 Apr 2024 04:32:18 +0000 | |||||||||||||||||||||||||||||||||||||||
| QR Codes: | |||||||||||||||||||||||||||||||||||||||
|
| |||||||||||||||||||||||||||||||||||||||
| Original text written by user: | |||||||||||||||||||||||||||||||||||||||
| IsPrivate? | No (this computation is public) | ||||||||||||||||||||||||||||||||||||||
| User-defined keywords | b382, cauchy, steven, coomans, thesis,verdeling | ||||||||||||||||||||||||||||||||||||||
| Estimated Impact | 225 | ||||||||||||||||||||||||||||||||||||||
Tree of Dependent Computations | |||||||||||||||||||||||||||||||||||||||
| Family? (F = Feedback message, R = changed R code, M = changed R Module, P = changed Parameters, D = changed Data) | |||||||||||||||||||||||||||||||||||||||
| - [Maximum-likelihood Fitting - Cauchy Distribution] [b382, cauchy, ste...] [2010-04-06 10:46:52] [d41d8cd98f00b204e9800998ecf8427e] [Current] | |||||||||||||||||||||||||||||||||||||||
| Feedback Forum | |||||||||||||||||||||||||||||||||||||||
Post a new message | |||||||||||||||||||||||||||||||||||||||
Dataset | |||||||||||||||||||||||||||||||||||||||
| Dataseries X: | |||||||||||||||||||||||||||||||||||||||
429.75 247.325 395.15 293.905 299.125 211.375 275.25 253.25 250.5 285.8 276 300.75 309.25 309.25 336.25 331.25 331.25 308.75 230.725 330.5 224.5 197.125 306.25 235.125 322.25 280.625 232.25 317.75 317.75 232.25 319.5 265.25 203.5 168.85 295.75 312.2 335.25 261.5 305.75 230 230 247.25 276.25 356.3 320.5 188.5 372.75 296 329.5 376.53 281.5 390 0 203.25 337 214.775 270 280 309.25 347 214.575 213.62 231.75 224.3 278 226.525 360.302 263.25 263.75 269.775 283.25 286.75 230.25 200.5 297.95 329.5 289.75 223.775 281.78 265.8 256.75 89.275 225.5 124.25 236.25 286.525 227 218.3 334.525 128.95 195.5 106.056 173.525 114.75 131.05 141.25 160.25 145.5 297.5 179.25 137 158.6 55.6 15.25 67.75 93 126.75 160 150.525 239.25 165.05 215.81 166 79.05 204.25 102 87.025 72.175 176.75 188.975 | |||||||||||||||||||||||||||||||||||||||
Tables (Output of Computation) | |||||||||||||||||||||||||||||||||||||||
| |||||||||||||||||||||||||||||||||||||||
Figures (Output of Computation) | |||||||||||||||||||||||||||||||||||||||
Input Parameters & R Code | |||||||||||||||||||||||||||||||||||||||
| Parameters (Session): | |||||||||||||||||||||||||||||||||||||||
| Parameters (R input): | |||||||||||||||||||||||||||||||||||||||
| R code (references can be found in the software module): | |||||||||||||||||||||||||||||||||||||||
library(MASS) | |||||||||||||||||||||||||||||||||||||||