Free Statistics
of Irreproducible Research!
Description of Statistical Computation | |||||||||||||||||||||||||||||||||||||||
|---|---|---|---|---|---|---|---|---|---|---|---|---|---|---|---|---|---|---|---|---|---|---|---|---|---|---|---|---|---|---|---|---|---|---|---|---|---|---|---|
| Author's title | |||||||||||||||||||||||||||||||||||||||
| Author | *Unverified author* | ||||||||||||||||||||||||||||||||||||||
| R Software Module | rwasp_fitdistrnorm.wasp | ||||||||||||||||||||||||||||||||||||||
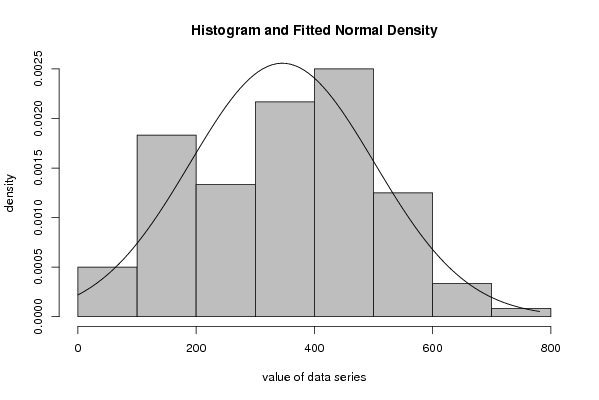
| Title produced by software | Maximum-likelihood Fitting - Normal Distribution | ||||||||||||||||||||||||||||||||||||||
| Date of computation | Tue, 06 Apr 2010 09:52:08 +0000 | ||||||||||||||||||||||||||||||||||||||
| Cite this page as follows | Statistical Computations at FreeStatistics.org, Office for Research Development and Education, URL https://freestatistics.org/blog/index.php?v=date/2010/Apr/06/t127054765376bgya4xvnekv2x.htm/, Retrieved Thu, 25 Apr 2024 11:30:46 +0000 | ||||||||||||||||||||||||||||||||||||||
| Statistical Computations at FreeStatistics.org, Office for Research Development and Education, URL https://freestatistics.org/blog/index.php?pk=74602, Retrieved Thu, 25 Apr 2024 11:30:46 +0000 | |||||||||||||||||||||||||||||||||||||||
| QR Codes: | |||||||||||||||||||||||||||||||||||||||
|
| |||||||||||||||||||||||||||||||||||||||
| Original text written by user: | |||||||||||||||||||||||||||||||||||||||
| IsPrivate? | No (this computation is public) | ||||||||||||||||||||||||||||||||||||||
| User-defined keywords | B28A, normaal verdeling, steven coomans, thesis | ||||||||||||||||||||||||||||||||||||||
| Estimated Impact | 227 | ||||||||||||||||||||||||||||||||||||||
Tree of Dependent Computations | |||||||||||||||||||||||||||||||||||||||
| Family? (F = Feedback message, R = changed R code, M = changed R Module, P = changed Parameters, D = changed Data) | |||||||||||||||||||||||||||||||||||||||
| - [Maximum-likelihood Fitting - Normal Distribution] [B28A, normaal ver...] [2010-04-06 09:52:08] [d41d8cd98f00b204e9800998ecf8427e] [Current] | |||||||||||||||||||||||||||||||||||||||
| Feedback Forum | |||||||||||||||||||||||||||||||||||||||
Post a new message | |||||||||||||||||||||||||||||||||||||||
Dataset | |||||||||||||||||||||||||||||||||||||||
| Dataseries X: | |||||||||||||||||||||||||||||||||||||||
288,125 331,5 493,025 378,75 458,625 431,25 399 473,5 442 177,425 346 450,25 509,625 509,625 301,375 374 374 311,875 300,375 352,75 454,25 208,7 470,85 490,125 551,125 522,8 577,875 384,25 384,25 552 661,5 457,1 647,5 174 781 277,1 653 435,75 613,775 509,75 509,75 314,5 486 212 503,825 435 563 457,05 451,25 500,75 437,75 470,5 0 313,25 314 454 570,5 485 243 310 421,752 494,5 253,5 417,5 182,826 339,25 199 412,25 438,25 356 266,25 235,25 323,775 305,25 383,527 515,25 496,15 115,25 170,5 154,25 170 534,05 193,75 564,5 213,63 308,25 437,05 410,275 149,75 154,75 240,1 127,525 222,25 85,525 427,75 63,5 118,3 99,5 182,25 401 119,5 450,25 147,5 237 80,025 10,5 176,75 234 282,5 320 167,5 163,25 238,15 325,125 126,3 154,875 327,25 336,25 188 277,25 | |||||||||||||||||||||||||||||||||||||||
Tables (Output of Computation) | |||||||||||||||||||||||||||||||||||||||
| |||||||||||||||||||||||||||||||||||||||
Figures (Output of Computation) | |||||||||||||||||||||||||||||||||||||||
Input Parameters & R Code | |||||||||||||||||||||||||||||||||||||||
| Parameters (Session): | |||||||||||||||||||||||||||||||||||||||
| par1 = 8 ; par2 = 0 ; | |||||||||||||||||||||||||||||||||||||||
| Parameters (R input): | |||||||||||||||||||||||||||||||||||||||
| par1 = 8 ; par2 = 0 ; | |||||||||||||||||||||||||||||||||||||||
| R code (references can be found in the software module): | |||||||||||||||||||||||||||||||||||||||
library(MASS) | |||||||||||||||||||||||||||||||||||||||