Free Statistics

of Irreproducible Research!

Author's title

Author*Unverified author*
R Software ModulePatrick.Wessarwasp_demand_forecasting_croston.wasp
Title produced by softwareCroston Forecasting
Date of computationFri, 02 Apr 2010 21:19:32 +0000
Cite this page as followsStatistical Computations at FreeStatistics.org, Office for Research Development and Education, URL https://freestatistics.org/blog/index.php?v=date/2010/Apr/02/t1270243417couvvtnt9u9n6zg.htm/, Retrieved Thu, 25 Apr 2024 05:03:15 +0000
Statistical Computations at FreeStatistics.org, Office for Research Development and Education, URL https://freestatistics.org/blog/index.php?pk=74590, Retrieved Thu, 25 Apr 2024 05:03:15 +0000
QR Codes:

Original text written by user:
IsPrivate?No (this computation is public)
User-defined keywordsthesis,steven coomans,mrt, 07, B28A
Estimated Impact266
Family? (F = Feedback message, R = changed R code, M = changed R Module, P = changed Parameters, D = changed Data)
-       [Croston Forecasting] [B28A missing valu...] [2010-04-02 21:19:32] [d41d8cd98f00b204e9800998ecf8427e] [Current]
Feedback Forum

Post a new message
Dataseries X:
288,125
331,5
493,025
378,75
458,625
431,25
399
473,5
442
177,425
346
450,25
509,625
509,625
301,375
374
374
311,875
300,375
352,75
454,25
208,7
470,85
490,125
551,125
522,8
577,875
384,25
384,25
552
661,5
457,1
647,5
174
781
277,1
653
435,75
613,775
509,75
509,75
314,5
486
212
503,825
435
563
457,05
451,25
500,75
437,75
470,5
0
313,25
314
454
570,5
485
243
310
421,752
494,5
253,5
417,5
182,826
339,25
199
412,25
438,25
356
266,25
235,25
323,775
305,25
383,527
515,25
496,15
115,25
170,5
154,25
170
534,05
193,75
564,5


Summary of computational transaction
Raw Inputview raw input (R code)
Raw Outputview raw output of R engine
Computing time3 seconds
R Serverwessa.org @ wessa.org

\begin{tabular}{lllllllll}
\hline
Summary of computational transaction \tabularnewline
Raw Input & view raw input (R code)  \tabularnewline
Raw Output & view raw output of R engine  \tabularnewline
Computing time & 3 seconds \tabularnewline
R Server & wessa.org @ wessa.org \tabularnewline
\hline
\end{tabular}
%Source: https://freestatistics.org/blog/index.php?pk=74590&T=0

[TABLE]
[ROW][C]Summary of computational transaction[/C][/ROW]
[ROW][C]Raw Input[/C][C]view raw input (R code) [/C][/ROW]
[ROW][C]Raw Output[/C][C]view raw output of R engine [/C][/ROW]
[ROW][C]Computing time[/C][C]3 seconds[/C][/ROW]
[ROW][C]R Server[/C][C]wessa.org @ wessa.org[/C][/ROW]
[/TABLE]
Source: https://freestatistics.org/blog/index.php?pk=74590&T=0

Globally Unique Identifier (entire table): ba.freestatistics.org/blog/index.php?pk=74590&T=0

As an alternative you can also use a QR Code:  

The GUIDs for individual cells are displayed in the table below:

Summary of computational transaction
Raw Inputview raw input (R code)
Raw Outputview raw output of R engine
Computing time3 seconds
R Serverwessa.org @ wessa.org


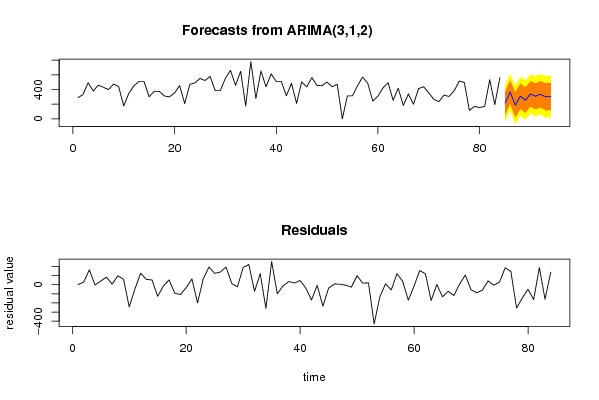
Demand Forecast
PointForecast95% LB80% LB80% UB95% UB
85213.626740433224-32.756679806895752.5252812107187374.72819965573460.010160673344
86364.523022208377117.982082473584203.318566524409525.727477892345611.063961943169
87188.925812398665-70.517974081950919.2846387048136358.566986092517448.369598879281
88308.71022692430244.728599495307136.101918519068481.318535329535572.691854353297
89256.24550023897-8.687461816852783.0151475564004429.47585292154521.178462294793
90339.20661703064874.2299289377782165.947673429227512.465560632068604.183305123517
91307.95036269766436.6593986097718130.562735941588485.33798945374579.241326785557
92334.54088707187859.3497316955663154.603062306541514.478711837214609.732042448189
93300.64903665119417.8085458612699115.709580298738485.58849300365583.489527441118
94305.89633390202820.0630332030948118.999984333921492.792683470135591.729634600961

\begin{tabular}{lllllllll}
\hline
Demand Forecast \tabularnewline
Point & Forecast & 95% LB & 80% LB & 80% UB & 95% UB \tabularnewline
85 & 213.626740433224 & -32.7566798068957 & 52.5252812107187 & 374.72819965573 & 460.010160673344 \tabularnewline
86 & 364.523022208377 & 117.982082473584 & 203.318566524409 & 525.727477892345 & 611.063961943169 \tabularnewline
87 & 188.925812398665 & -70.5179740819509 & 19.2846387048136 & 358.566986092517 & 448.369598879281 \tabularnewline
88 & 308.710226924302 & 44.728599495307 & 136.101918519068 & 481.318535329535 & 572.691854353297 \tabularnewline
89 & 256.24550023897 & -8.6874618168527 & 83.0151475564004 & 429.47585292154 & 521.178462294793 \tabularnewline
90 & 339.206617030648 & 74.2299289377782 & 165.947673429227 & 512.465560632068 & 604.183305123517 \tabularnewline
91 & 307.950362697664 & 36.6593986097718 & 130.562735941588 & 485.33798945374 & 579.241326785557 \tabularnewline
92 & 334.540887071878 & 59.3497316955663 & 154.603062306541 & 514.478711837214 & 609.732042448189 \tabularnewline
93 & 300.649036651194 & 17.8085458612699 & 115.709580298738 & 485.58849300365 & 583.489527441118 \tabularnewline
94 & 305.896333902028 & 20.0630332030948 & 118.999984333921 & 492.792683470135 & 591.729634600961 \tabularnewline
\hline
\end{tabular}
%Source: https://freestatistics.org/blog/index.php?pk=74590&T=1

[TABLE]
[ROW][C]Demand Forecast[/C][/ROW]
[ROW][C]Point[/C][C]Forecast[/C][C]95% LB[/C][C]80% LB[/C][C]80% UB[/C][C]95% UB[/C][/ROW]
[ROW][C]85[/C][C]213.626740433224[/C][C]-32.7566798068957[/C][C]52.5252812107187[/C][C]374.72819965573[/C][C]460.010160673344[/C][/ROW]
[ROW][C]86[/C][C]364.523022208377[/C][C]117.982082473584[/C][C]203.318566524409[/C][C]525.727477892345[/C][C]611.063961943169[/C][/ROW]
[ROW][C]87[/C][C]188.925812398665[/C][C]-70.5179740819509[/C][C]19.2846387048136[/C][C]358.566986092517[/C][C]448.369598879281[/C][/ROW]
[ROW][C]88[/C][C]308.710226924302[/C][C]44.728599495307[/C][C]136.101918519068[/C][C]481.318535329535[/C][C]572.691854353297[/C][/ROW]
[ROW][C]89[/C][C]256.24550023897[/C][C]-8.6874618168527[/C][C]83.0151475564004[/C][C]429.47585292154[/C][C]521.178462294793[/C][/ROW]
[ROW][C]90[/C][C]339.206617030648[/C][C]74.2299289377782[/C][C]165.947673429227[/C][C]512.465560632068[/C][C]604.183305123517[/C][/ROW]
[ROW][C]91[/C][C]307.950362697664[/C][C]36.6593986097718[/C][C]130.562735941588[/C][C]485.33798945374[/C][C]579.241326785557[/C][/ROW]
[ROW][C]92[/C][C]334.540887071878[/C][C]59.3497316955663[/C][C]154.603062306541[/C][C]514.478711837214[/C][C]609.732042448189[/C][/ROW]
[ROW][C]93[/C][C]300.649036651194[/C][C]17.8085458612699[/C][C]115.709580298738[/C][C]485.58849300365[/C][C]583.489527441118[/C][/ROW]
[ROW][C]94[/C][C]305.896333902028[/C][C]20.0630332030948[/C][C]118.999984333921[/C][C]492.792683470135[/C][C]591.729634600961[/C][/ROW]
[/TABLE]
Source: https://freestatistics.org/blog/index.php?pk=74590&T=1

Globally Unique Identifier (entire table): ba.freestatistics.org/blog/index.php?pk=74590&T=1

As an alternative you can also use a QR Code:  

The GUIDs for individual cells are displayed in the table below:

Demand Forecast
PointForecast95% LB80% LB80% UB95% UB
85213.626740433224-32.756679806895752.5252812107187374.72819965573460.010160673344
86364.523022208377117.982082473584203.318566524409525.727477892345611.063961943169
87188.925812398665-70.517974081950919.2846387048136358.566986092517448.369598879281
88308.71022692430244.728599495307136.101918519068481.318535329535572.691854353297
89256.24550023897-8.687461816852783.0151475564004429.47585292154521.178462294793
90339.20661703064874.2299289377782165.947673429227512.465560632068604.183305123517
91307.95036269766436.6593986097718130.562735941588485.33798945374579.241326785557
92334.54088707187859.3497316955663154.603062306541514.478711837214609.732042448189
93300.64903665119417.8085458612699115.709580298738485.58849300365583.489527441118
94305.89633390202820.0630332030948118.999984333921492.792683470135591.729634600961


\begin{tabular}{lllllllll}
\hline
What is next? \tabularnewline
Simulate Time Series \tabularnewline
Generate Forecasts \tabularnewline
Forecast Analysis \tabularnewline
\hline
\end{tabular}
%Source: https://freestatistics.org/blog/index.php?pk=74590&T=2

[TABLE]
[ROW][C]What is next?[/C][/ROW]
[ROW][C]Simulate Time Series[/C][/ROW]
[ROW][C]Generate Forecasts[/C][/ROW]
[ROW][C]Forecast Analysis[/C][/ROW]
[/TABLE]
Source: https://freestatistics.org/blog/index.php?pk=74590&T=2

Globally Unique Identifier (entire table): ba.freestatistics.org/blog/index.php?pk=74590&T=2

As an alternative you can also use a QR Code:  

The GUIDs for individual cells are displayed in the table below:

What is next?
Simulate Time Series
Generate Forecasts
Forecast Analysis


Parameters (Session):
par1 = Input box ; par2 = ARIMA ; par3 = NA ; par4 = NA ; par5 = ZZZ ; par6 = 1 ; par8 = dumresult ; par9 = 1 ; par10 = 0.1 ;
Parameters (R input):
par1 = Input box ; par2 = ARIMA ; par3 = NA ; par4 = NA ; par5 = ZZZ ; par6 = 1 ; par7 = ; par8 = dumresult ; par9 = 1 ; par10 = 0.1 ;
R code (references can be found in the software module):
if(par3!='NA') par3 <- as.numeric(par3) else par3 <- NA
if(par4!='NA') par4 <- as.numeric(par4) else par4 <- NA
par6 <- as.numeric(par6) #Seasonal Period
par9 <- as.numeric(par9) #Forecast Horizon
par10 <- as.numeric(par10) #Alpha
library(forecast)
if (par1 == 'CSV') {
xarr <- read.csv(file=paste('tmp/',par7,'.csv',sep=''),header=T)
numseries <- length(xarr[1,])-1
n <- length(xarr[,1])
nmh <- n - par9
nmhp1 <- nmh + 1
rarr <- array(NA,dim=c(n,numseries))
farr <- array(NA,dim=c(n,numseries))
parr <- array(NA,dim=c(numseries,8))
colnames(parr) = list('ME','RMSE','MAE','MPE','MAPE','MASE','ACF1','TheilU')
for(i in 1:numseries) {
sindex <- i+1
x <- xarr[,sindex]
if(par2=='Croston') {
if (i==1) m <- croston(x,alpha=par10)
if (i==1) mydemand <- m$model$demand[]
fit <- croston(x[1:nmh],h=par9,alpha=par10)
}
if(par2=='ARIMA') {
m <- auto.arima(ts(x,freq=par6),d=par3,D=par4)
mydemand <- forecast(m)
fit <- auto.arima(ts(x[1:nmh],freq=par6),d=par3,D=par4)
}
if(par2=='ETS') {
m <- ets(ts(x,freq=par6),model=par5)
mydemand <- forecast(m)
fit <- ets(ts(x[1:nmh],freq=par6),model=par5)
}
try(rarr[,i] <- mydemand$resid,silent=T)
try(farr[,i] <- mydemand$mean,silent=T)
if (par2!='Croston') parr[i,] <- accuracy(forecast(fit,par9),x[nmhp1:n])
if (par2=='Croston') parr[i,] <- accuracy(fit,x[nmhp1:n])
}
write.csv(farr,file=paste('tmp/',par8,'_f.csv',sep=''))
write.csv(rarr,file=paste('tmp/',par8,'_r.csv',sep=''))
write.csv(parr,file=paste('tmp/',par8,'_p.csv',sep=''))
}
if (par1 == 'Input box') {
numseries <- 1
n <- length(x)
if(par2=='Croston') {
m <- croston(x)
mydemand <- m$model$demand[]
}
if(par2=='ARIMA') {
m <- auto.arima(ts(x,freq=par6),d=par3,D=par4)
mydemand <- forecast(m)
}
if(par2=='ETS') {
m <- ets(ts(x,freq=par6),model=par5)
mydemand <- forecast(m)
}
summary(m)
}
bitmap(file='test1.png')
op <- par(mfrow=c(2,1))
if (par2=='Croston') plot(m)
if ((par2=='ARIMA') | par2=='ETS') plot(forecast(m))
plot(mydemand$resid,type='l',main='Residuals', ylab='residual value', xlab='time')
par(op)
dev.off()
bitmap(file='pic2.png')
op <- par(mfrow=c(2,2))
acf(mydemand$resid, lag.max=n/3, main='Residual ACF', ylab='autocorrelation', xlab='time lag')
pacf(mydemand$resid,lag.max=n/3, main='Residual PACF', ylab='partial autocorrelation', xlab='time lag')
cpgram(mydemand$resid, main='Cumulative Periodogram of Residuals')
qqnorm(mydemand$resid); qqline(mydemand$resid, col=2)
par(op)
dev.off()
load(file='createtable')
a<-table.start()
a<-table.row.start(a)
a<-table.element(a,'Demand Forecast',6,TRUE)
a<-table.row.end(a)
a<-table.row.start(a)
a<-table.element(a,'Point',header=TRUE)
a<-table.element(a,'Forecast',header=TRUE)
a<-table.element(a,'95% LB',header=TRUE)
a<-table.element(a,'80% LB',header=TRUE)
a<-table.element(a,'80% UB',header=TRUE)
a<-table.element(a,'95% UB',header=TRUE)
a<-table.row.end(a)
for (i in 1:length(mydemand$mean)) {
a<-table.row.start(a)
a<-table.element(a,i+n,header=TRUE)
a<-table.element(a,as.numeric(mydemand$mean[i]))
a<-table.element(a,as.numeric(mydemand$lower[i,2]))
a<-table.element(a,as.numeric(mydemand$lower[i,1]))
a<-table.element(a,as.numeric(mydemand$upper[i,1]))
a<-table.element(a,as.numeric(mydemand$upper[i,2]))
a<-table.row.end(a)
}
a<-table.end(a)
table.save(a,file='mytable.tab')
a<-table.start()
a<-table.row.start(a)
a<-table.element(a,'What is next?',1,TRUE)
a<-table.row.end(a)
a<-table.row.start(a)
a<-table.element(a,hyperlink(paste('https://automated.biganalytics.eu/Patrick.Wessa/rwasp_demand_forecasting_simulate.wasp',sep=''),'Simulate Time Series','',target=''))
a<-table.row.end(a)
a<-table.row.start(a)
a<-table.element(a,hyperlink(paste('https://automated.biganalytics.eu/Patrick.Wessa/rwasp_demand_forecasting_croston.wasp#output',sep=''),'Generate Forecasts','',target=''))
a<-table.row.end(a)
a<-table.row.start(a)
a<-table.element(a,hyperlink(paste('https://automated.biganalytics.eu/Patrick.Wessa/rwasp_demand_forecasting_analysis.wasp',sep=''),'Forecast Analysis','',target=''))
a<-table.row.end(a)
a<-table.end(a)
table.save(a,file='mytable0.tab')
-SERVER-wessa.org