Free Statistics
of Irreproducible Research!
Description of Statistical Computation | |||||||||||||||||||||||||||||||||||||||||
|---|---|---|---|---|---|---|---|---|---|---|---|---|---|---|---|---|---|---|---|---|---|---|---|---|---|---|---|---|---|---|---|---|---|---|---|---|---|---|---|---|---|
| Author's title | |||||||||||||||||||||||||||||||||||||||||
| Author | *Unverified author* | ||||||||||||||||||||||||||||||||||||||||
| R Software Module | rwasp_univariatedataseries.wasp | ||||||||||||||||||||||||||||||||||||||||
| Title produced by software | Univariate Data Series | ||||||||||||||||||||||||||||||||||||||||
| Date of computation | Wed, 30 Sep 2009 14:00:26 -0600 | ||||||||||||||||||||||||||||||||||||||||
| Cite this page as follows | Statistical Computations at FreeStatistics.org, Office for Research Development and Education, URL https://freestatistics.org/blog/index.php?v=date/2009/Sep/30/t12543409155g6p205nn05tybt.htm/, Retrieved Fri, 19 Apr 2024 17:07:19 +0000 | ||||||||||||||||||||||||||||||||||||||||
| Statistical Computations at FreeStatistics.org, Office for Research Development and Education, URL https://freestatistics.org/blog/index.php?pk=43134, Retrieved Fri, 19 Apr 2024 17:07:19 +0000 | |||||||||||||||||||||||||||||||||||||||||
| QR Codes: | |||||||||||||||||||||||||||||||||||||||||
|
| |||||||||||||||||||||||||||||||||||||||||
| Original text written by user: | |||||||||||||||||||||||||||||||||||||||||
| IsPrivate? | No (this computation is public) | ||||||||||||||||||||||||||||||||||||||||
| User-defined keywords | KDGP1W1 | ||||||||||||||||||||||||||||||||||||||||
| Estimated Impact | 236 | ||||||||||||||||||||||||||||||||||||||||
Tree of Dependent Computations | |||||||||||||||||||||||||||||||||||||||||
| Family? (F = Feedback message, R = changed R code, M = changed R Module, P = changed Parameters, D = changed Data) | |||||||||||||||||||||||||||||||||||||||||
| - [Univariate Data Series] [Index benzine loo...] [2009-09-30 20:00:26] [1596366c2ece8f787477cc7d1246d4c7] [Current] | |||||||||||||||||||||||||||||||||||||||||
| Feedback Forum | |||||||||||||||||||||||||||||||||||||||||
Post a new message | |||||||||||||||||||||||||||||||||||||||||
Dataset | |||||||||||||||||||||||||||||||||||||||||
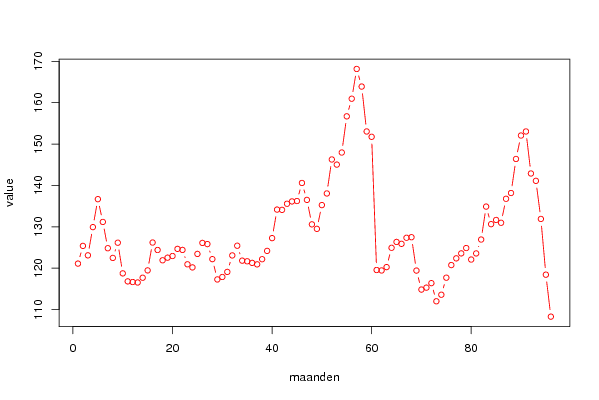
| Dataseries X: | |||||||||||||||||||||||||||||||||||||||||
121.1 125.38 123.1 129.92 136.68 131.17 124.82 122.47 126.15 118.74 116.8 116.64 116.53 117.68 119.46 126.19 124.39 121.9 122.53 122.93 124.66 124.41 120.93 120.18 123.44 126.1 125.82 122.18 117.27 117.86 119.09 123.08 125.42 121.81 121.66 121.27 120.92 122.16 124.17 127.26 134.16 134.09 135.57 136.13 136.23 140.6 136.5 130.59 129.5 135.25 138.06 146.28 145.04 147.96 156.71 160.97 168.17 163.91 153.05 151.76 119.55 119.44 120.25 124.92 126.34 125.88 127.34 127.48 119.41 114.82 115.28 116.37 111.99 113.57 117.69 120.74 122.37 123.57 124.86 122.08 123.56 126.92 134.88 130.64 131.65 130.97 136.77 138.17 146.4 152.07 153.05 142.89 141.11 131.9 118.42 108.27 | |||||||||||||||||||||||||||||||||||||||||
Tables (Output of Computation) | |||||||||||||||||||||||||||||||||||||||||
| |||||||||||||||||||||||||||||||||||||||||
Figures (Output of Computation) | |||||||||||||||||||||||||||||||||||||||||
Input Parameters & R Code | |||||||||||||||||||||||||||||||||||||||||
| Parameters (Session): | |||||||||||||||||||||||||||||||||||||||||
| par1 = Index superplus loodvrij 98 ; par2 = belgistat ; par3 = Index benzine ; | |||||||||||||||||||||||||||||||||||||||||
| Parameters (R input): | |||||||||||||||||||||||||||||||||||||||||
| par1 = Index superplus loodvrij 98 ; par2 = belgistat ; par3 = Index benzine ; | |||||||||||||||||||||||||||||||||||||||||
| R code (references can be found in the software module): | |||||||||||||||||||||||||||||||||||||||||
bitmap(file='test1.png') | |||||||||||||||||||||||||||||||||||||||||