Free Statistics
of Irreproducible Research!
Description of Statistical Computation | |||||||||||||||||||||||||||||||||||||||||
|---|---|---|---|---|---|---|---|---|---|---|---|---|---|---|---|---|---|---|---|---|---|---|---|---|---|---|---|---|---|---|---|---|---|---|---|---|---|---|---|---|---|
| Author's title | |||||||||||||||||||||||||||||||||||||||||
| Author | *Unverified author* | ||||||||||||||||||||||||||||||||||||||||
| R Software Module | rwasp_univariatedataseries.wasp | ||||||||||||||||||||||||||||||||||||||||
| Title produced by software | Univariate Data Series | ||||||||||||||||||||||||||||||||||||||||
| Date of computation | Tue, 29 Sep 2009 05:13:01 -0600 | ||||||||||||||||||||||||||||||||||||||||
| Cite this page as follows | Statistical Computations at FreeStatistics.org, Office for Research Development and Education, URL https://freestatistics.org/blog/index.php?v=date/2009/Sep/29/t1254223084cbm5ee325nkruoh.htm/, Retrieved Thu, 18 Apr 2024 18:44:35 +0000 | ||||||||||||||||||||||||||||||||||||||||
| Statistical Computations at FreeStatistics.org, Office for Research Development and Education, URL https://freestatistics.org/blog/index.php?pk=43083, Retrieved Thu, 18 Apr 2024 18:44:35 +0000 | |||||||||||||||||||||||||||||||||||||||||
| QR Codes: | |||||||||||||||||||||||||||||||||||||||||
|
| |||||||||||||||||||||||||||||||||||||||||
| Original text written by user: | |||||||||||||||||||||||||||||||||||||||||
| IsPrivate? | No (this computation is public) | ||||||||||||||||||||||||||||||||||||||||
| User-defined keywords | |||||||||||||||||||||||||||||||||||||||||
| Estimated Impact | 194 | ||||||||||||||||||||||||||||||||||||||||
Tree of Dependent Computations | |||||||||||||||||||||||||||||||||||||||||
| Family? (F = Feedback message, R = changed R code, M = changed R Module, P = changed Parameters, D = changed Data) | |||||||||||||||||||||||||||||||||||||||||
| - [Univariate Data Series] [Gemiddelde rentev...] [2009-09-29 11:13:01] [ab2b68d5442f7c9b7e2e9d790849a234] [Current] | |||||||||||||||||||||||||||||||||||||||||
| Feedback Forum | |||||||||||||||||||||||||||||||||||||||||
Post a new message | |||||||||||||||||||||||||||||||||||||||||
Dataset | |||||||||||||||||||||||||||||||||||||||||
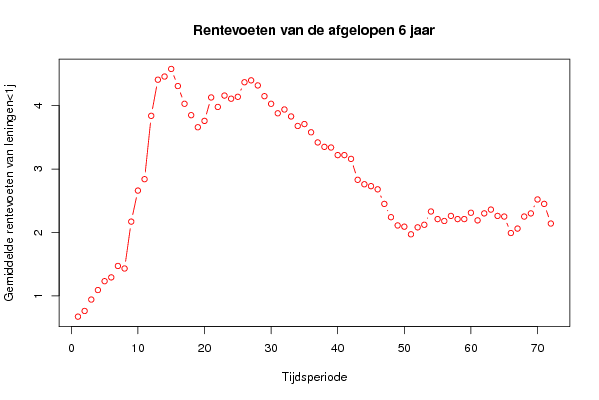
| Dataseries X: | |||||||||||||||||||||||||||||||||||||||||
0.67 0.76 0.94 1.09 1.23 1.29 1.47 1.43 2.17 2.66 2.84 3.84 4.41 4.46 4.58 4.31 4.03 3.85 3.66 3.76 4.13 3.98 4.16 4.11 4.14 4.37 4.4 4.32 4.15 4.03 3.88 3.94 3.83 3.68 3.71 3.58 3.42 3.35 3.34 3.22 3.22 3.16 2.83 2.76 2.73 2.68 2.45 2.24 2.11 2.09 1.97 2.08 2.12 2.33 2.21 2.18 2.26 2.21 2.21 2.31 2.19 2.3 2.36 2.26 2.25 1.99 2.06 2.25 2.3 2.52 2.45 2.14 | |||||||||||||||||||||||||||||||||||||||||
Tables (Output of Computation) | |||||||||||||||||||||||||||||||||||||||||
| |||||||||||||||||||||||||||||||||||||||||
Figures (Output of Computation) | |||||||||||||||||||||||||||||||||||||||||
Input Parameters & R Code | |||||||||||||||||||||||||||||||||||||||||
| Parameters (Session): | |||||||||||||||||||||||||||||||||||||||||
| par1 = Gemiddelde rentevoeten van leningen < 1 jaar ; par2 = Belgostat ; par3 = De gemiddelde rentevoet van leningen < 1 jaar gezien over een periode van de afgelopen zes jaar ; | |||||||||||||||||||||||||||||||||||||||||
| Parameters (R input): | |||||||||||||||||||||||||||||||||||||||||
| par1 = Gemiddelde rentevoeten van leningen < 1 jaar ; par2 = Belgostat ; par3 = De gemiddelde rentevoet van leningen < 1 jaar gezien over een periode van de afgelopen zes jaar ; | |||||||||||||||||||||||||||||||||||||||||
| R code (references can be found in the software module): | |||||||||||||||||||||||||||||||||||||||||
bitmap(file='test1.png') | |||||||||||||||||||||||||||||||||||||||||