Free Statistics
of Irreproducible Research!
Description of Statistical Computation | |||||||||||||||||||||||||||||||||||||||||
|---|---|---|---|---|---|---|---|---|---|---|---|---|---|---|---|---|---|---|---|---|---|---|---|---|---|---|---|---|---|---|---|---|---|---|---|---|---|---|---|---|---|
| Author's title | |||||||||||||||||||||||||||||||||||||||||
| Author | *Unverified author* | ||||||||||||||||||||||||||||||||||||||||
| R Software Module | rwasp_univariatedataseries.wasp | ||||||||||||||||||||||||||||||||||||||||
| Title produced by software | Univariate Data Series | ||||||||||||||||||||||||||||||||||||||||
| Date of computation | Mon, 28 Sep 2009 16:40:28 -0600 | ||||||||||||||||||||||||||||||||||||||||
| Cite this page as follows | Statistical Computations at FreeStatistics.org, Office for Research Development and Education, URL https://freestatistics.org/blog/index.php?v=date/2009/Sep/29/t1254177711dqn2pf1zy59s0vp.htm/, Retrieved Fri, 19 Apr 2024 10:04:50 +0000 | ||||||||||||||||||||||||||||||||||||||||
| Statistical Computations at FreeStatistics.org, Office for Research Development and Education, URL https://freestatistics.org/blog/index.php?pk=43070, Retrieved Fri, 19 Apr 2024 10:04:50 +0000 | |||||||||||||||||||||||||||||||||||||||||
| QR Codes: | |||||||||||||||||||||||||||||||||||||||||
|
| |||||||||||||||||||||||||||||||||||||||||
| Original text written by user: | |||||||||||||||||||||||||||||||||||||||||
| IsPrivate? | No (this computation is public) | ||||||||||||||||||||||||||||||||||||||||
| User-defined keywords | KDGP1W1 | ||||||||||||||||||||||||||||||||||||||||
| Estimated Impact | 223 | ||||||||||||||||||||||||||||||||||||||||
Tree of Dependent Computations | |||||||||||||||||||||||||||||||||||||||||
| Family? (F = Feedback message, R = changed R code, M = changed R Module, P = changed Parameters, D = changed Data) | |||||||||||||||||||||||||||||||||||||||||
| - [Univariate Data Series] [Evolution of real...] [2009-09-28 22:40:28] [3f12ab8801f7554f488f56dad3cd0b03] [Current] - RMPD [Kernel Density Estimation] [Evolution of real...] [2009-10-03 19:30:11] [ae313ad3bd3ddca83679957b8289cb77] - RMPD [Notched Boxplots] [Maximumprijs 2005] [2009-10-10 12:49:36] [ae313ad3bd3ddca83679957b8289cb77] - RMPD [Notched Boxplots] [Leningen vastgoed VS] [2009-10-10 13:04:04] [ae313ad3bd3ddca83679957b8289cb77] - RMPD [Harrell-Davis Quantiles] [Opgave 4.2] [2009-10-17 13:44:37] [ae313ad3bd3ddca83679957b8289cb77] - RMPD [Central Tendency] [Opgave 5.2] [2009-10-24 14:02:41] [ae313ad3bd3ddca83679957b8289cb77] - RMPD [Mean versus Median] [Opgave 5.2.2] [2009-10-24 14:10:17] [ae313ad3bd3ddca83679957b8289cb77] | |||||||||||||||||||||||||||||||||||||||||
| Feedback Forum | |||||||||||||||||||||||||||||||||||||||||
Post a new message | |||||||||||||||||||||||||||||||||||||||||
Dataset | |||||||||||||||||||||||||||||||||||||||||
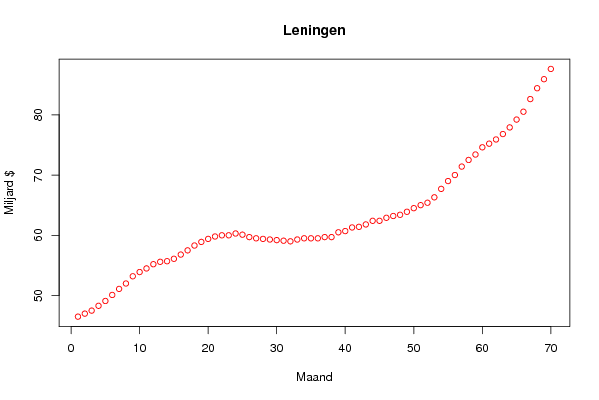
| Dataseries X: | |||||||||||||||||||||||||||||||||||||||||
46,5 47 47,5 48,3 49,1 50,1 51,1 52 53,2 53,9 54,5 55,2 55,6 55,7 56,1 56,8 57,5 58,3 58,9 59,4 59,8 60 60 60,3 60,1 59,7 59,5 59,4 59,3 59,2 59,1 59 59,3 59,5 59,5 59,5 59,7 59,7 60,5 60,7 61,3 61,4 61,8 62,4 62,4 62,9 63,2 63,4 63,9 64,5 65 65,4 66,3 67,7 69 70 71,4 72,5 73,4 74,6 75,2 75,9 76,8 77,9 79,2 80,5 82,6 84,4 85,9 87,6 | |||||||||||||||||||||||||||||||||||||||||
Tables (Output of Computation) | |||||||||||||||||||||||||||||||||||||||||
| |||||||||||||||||||||||||||||||||||||||||
Figures (Output of Computation) | |||||||||||||||||||||||||||||||||||||||||
Input Parameters & R Code | |||||||||||||||||||||||||||||||||||||||||
| Parameters (Session): | |||||||||||||||||||||||||||||||||||||||||
| par1 = Evolute leningen op onroerend goed ; par2 = http://www.robjhyndman.com/TSDL/index.htm ; par3 = Evolutie leningen onroerend goed ; | |||||||||||||||||||||||||||||||||||||||||
| Parameters (R input): | |||||||||||||||||||||||||||||||||||||||||
| par1 = Evolute leningen op onroerend goed ; par2 = http://www.robjhyndman.com/TSDL/index.htm ; par3 = Evolutie leningen onroerend goed ; | |||||||||||||||||||||||||||||||||||||||||
| R code (references can be found in the software module): | |||||||||||||||||||||||||||||||||||||||||
bitmap(file='test1.png') | |||||||||||||||||||||||||||||||||||||||||