Free Statistics
of Irreproducible Research!
Description of Statistical Computation | |||||||||||||||||||||||||||||||||||||||||
|---|---|---|---|---|---|---|---|---|---|---|---|---|---|---|---|---|---|---|---|---|---|---|---|---|---|---|---|---|---|---|---|---|---|---|---|---|---|---|---|---|---|
| Author's title | |||||||||||||||||||||||||||||||||||||||||
| Author | *Unverified author* | ||||||||||||||||||||||||||||||||||||||||
| R Software Module | rwasp_univariatedataseries.wasp | ||||||||||||||||||||||||||||||||||||||||
| Title produced by software | Univariate Data Series | ||||||||||||||||||||||||||||||||||||||||
| Date of computation | Sat, 26 Sep 2009 12:04:17 -0600 | ||||||||||||||||||||||||||||||||||||||||
| Cite this page as follows | Statistical Computations at FreeStatistics.org, Office for Research Development and Education, URL https://freestatistics.org/blog/index.php?v=date/2009/Sep/26/t12539888398usc24v0bmsonfx.htm/, Retrieved Thu, 25 Apr 2024 05:31:18 +0000 | ||||||||||||||||||||||||||||||||||||||||
| Statistical Computations at FreeStatistics.org, Office for Research Development and Education, URL https://freestatistics.org/blog/index.php?pk=43043, Retrieved Thu, 25 Apr 2024 05:31:18 +0000 | |||||||||||||||||||||||||||||||||||||||||
| QR Codes: | |||||||||||||||||||||||||||||||||||||||||
|
| |||||||||||||||||||||||||||||||||||||||||
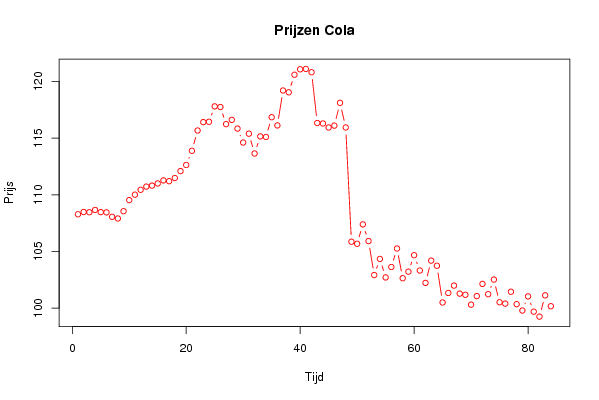
| Original text written by user: | Opgave 1: Inleiding tot kwantitatief onderzoek. Grafiek prijzen Cola 2002-2008 | ||||||||||||||||||||||||||||||||||||||||
| IsPrivate? | No (this computation is public) | ||||||||||||||||||||||||||||||||||||||||
| User-defined keywords | KDGP1W1 | ||||||||||||||||||||||||||||||||||||||||
| Estimated Impact | 214 | ||||||||||||||||||||||||||||||||||||||||
Tree of Dependent Computations | |||||||||||||||||||||||||||||||||||||||||
| Family? (F = Feedback message, R = changed R code, M = changed R Module, P = changed Parameters, D = changed Data) | |||||||||||||||||||||||||||||||||||||||||
| - [Univariate Data Series] [Prijzenvergelijk ...] [2009-09-26 18:04:17] [b37bab310ab56201887748d7a7c0dc58] [Current] | |||||||||||||||||||||||||||||||||||||||||
| Feedback Forum | |||||||||||||||||||||||||||||||||||||||||
Post a new message | |||||||||||||||||||||||||||||||||||||||||
Dataset | |||||||||||||||||||||||||||||||||||||||||
| Dataseries X: | |||||||||||||||||||||||||||||||||||||||||
108.28 108.48 108.46 108.66 108.47 108.45 108.06 107.91 108.55 109.53 110.01 110.44 110.72 110.81 111 111.27 111.2 111.48 112.09 112.63 113.88 115.67 116.41 116.44 117.8 117.74 116.23 116.61 115.84 114.61 115.39 113.64 115.15 115.1 116.84 116.12 119.2 119.04 120.59 121.07 121.1 120.81 116.33 116.29 115.94 116.1 118.11 115.94 105.86 105.68 107.39 105.92 102.92 104.34 102.71 103.63 105.26 102.64 103.22 104.67 103.32 102.23 104.19 103.74 100.5 101.34 101.99 101.28 101.18 100.31 101.06 102.14 101.23 102.52 100.52 100.4 101.45 100.35 99.79 101.04 99.69 99.25 101.13 100.17 | |||||||||||||||||||||||||||||||||||||||||
Tables (Output of Computation) | |||||||||||||||||||||||||||||||||||||||||
| |||||||||||||||||||||||||||||||||||||||||
Figures (Output of Computation) | |||||||||||||||||||||||||||||||||||||||||
Input Parameters & R Code | |||||||||||||||||||||||||||||||||||||||||
| Parameters (Session): | |||||||||||||||||||||||||||||||||||||||||
| par1 = Prijsvergelijking Cola ; par2 = www.belgostat.be ; par3 = Deze reeks geeft de prijsfluctuaties weer van 2002 tot 2008 ; | |||||||||||||||||||||||||||||||||||||||||
| Parameters (R input): | |||||||||||||||||||||||||||||||||||||||||
| par1 = Prijsvergelijking Cola ; par2 = www.belgostat.be ; par3 = Deze reeks geeft de prijsfluctuaties weer van 2002 tot 2008 ; | |||||||||||||||||||||||||||||||||||||||||
| R code (references can be found in the software module): | |||||||||||||||||||||||||||||||||||||||||
bitmap(file='test1.png') | |||||||||||||||||||||||||||||||||||||||||