Free Statistics
of Irreproducible Research!
Description of Statistical Computation | |||||||||||||||||||||||||||||||||||||||||
|---|---|---|---|---|---|---|---|---|---|---|---|---|---|---|---|---|---|---|---|---|---|---|---|---|---|---|---|---|---|---|---|---|---|---|---|---|---|---|---|---|---|
| Author's title | |||||||||||||||||||||||||||||||||||||||||
| Author | *Unverified author* | ||||||||||||||||||||||||||||||||||||||||
| R Software Module | rwasp_univariatedataseries.wasp | ||||||||||||||||||||||||||||||||||||||||
| Title produced by software | Univariate Data Series | ||||||||||||||||||||||||||||||||||||||||
| Date of computation | Sat, 26 Sep 2009 07:45:03 -0600 | ||||||||||||||||||||||||||||||||||||||||
| Cite this page as follows | Statistical Computations at FreeStatistics.org, Office for Research Development and Education, URL https://freestatistics.org/blog/index.php?v=date/2009/Sep/26/t12539728197n7n4pdojff59ks.htm/, Retrieved Fri, 19 Apr 2024 20:51:50 +0000 | ||||||||||||||||||||||||||||||||||||||||
| Statistical Computations at FreeStatistics.org, Office for Research Development and Education, URL https://freestatistics.org/blog/index.php?pk=43037, Retrieved Fri, 19 Apr 2024 20:51:50 +0000 | |||||||||||||||||||||||||||||||||||||||||
| QR Codes: | |||||||||||||||||||||||||||||||||||||||||
|
| |||||||||||||||||||||||||||||||||||||||||
| Original text written by user: | |||||||||||||||||||||||||||||||||||||||||
| IsPrivate? | No (this computation is public) | ||||||||||||||||||||||||||||||||||||||||
| User-defined keywords | KDGP1W1 | ||||||||||||||||||||||||||||||||||||||||
| Estimated Impact | 217 | ||||||||||||||||||||||||||||||||||||||||
Tree of Dependent Computations | |||||||||||||||||||||||||||||||||||||||||
| Family? (F = Feedback message, R = changed R code, M = changed R Module, P = changed Parameters, D = changed Data) | |||||||||||||||||||||||||||||||||||||||||
| - [Univariate Data Series] [Frequentietabel] [2009-09-26 13:45:03] [99dd5e7f67b5ad84b7cfa9edf27cffe4] [Current] - RMP [Histogram] [Histogram oefening 2] [2009-10-03 15:41:43] [4ef36953ac96474260c49165aa503bfa] - RMP [Kernel Density Estimation] [Oefening 2 dichth...] [2009-10-03 16:09:38] [4ef36953ac96474260c49165aa503bfa] - R P [Histogram] [Gewijzigde histog...] [2009-10-06 11:12:07] [74be16979710d4c4e7c6647856088456] - R P [Histogram] [Gewijzigde histog...] [2009-10-06 11:13:58] [74be16979710d4c4e7c6647856088456] | |||||||||||||||||||||||||||||||||||||||||
| Feedback Forum | |||||||||||||||||||||||||||||||||||||||||
Post a new message | |||||||||||||||||||||||||||||||||||||||||
Dataset | |||||||||||||||||||||||||||||||||||||||||
| Dataseries X: | |||||||||||||||||||||||||||||||||||||||||
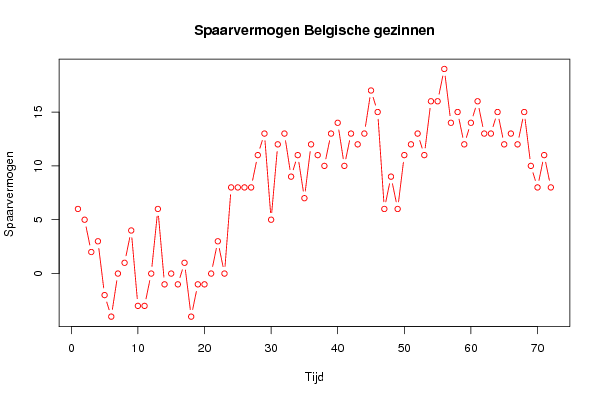
6 5 2 3 -2 -4 0 1 4 -3 -3 0 6 -1 0 -1 1 -4 -1 -1 0 3 0 8 8 8 8 11 13 5 12 13 9 11 7 12 11 10 13 14 10 13 12 13 17 15 6 9 6 11 12 13 11 16 16 19 14 15 12 14 16 13 13 15 12 13 12 15 10 8 11 8 | |||||||||||||||||||||||||||||||||||||||||
Tables (Output of Computation) | |||||||||||||||||||||||||||||||||||||||||
| |||||||||||||||||||||||||||||||||||||||||
Figures (Output of Computation) | |||||||||||||||||||||||||||||||||||||||||
Input Parameters & R Code | |||||||||||||||||||||||||||||||||||||||||
| Parameters (Session): | |||||||||||||||||||||||||||||||||||||||||
| par1 = Spaarvermogen gezinnen ; par2 = Belgostat ; par3 = Deze data geeft het maandelijks spaarvermogen van de Belgische gezinnen weer. ; | |||||||||||||||||||||||||||||||||||||||||
| Parameters (R input): | |||||||||||||||||||||||||||||||||||||||||
| par1 = Spaarvermogen gezinnen ; par2 = Belgostat ; par3 = Deze data geeft het maandelijks spaarvermogen van de Belgische gezinnen weer. ; | |||||||||||||||||||||||||||||||||||||||||
| R code (references can be found in the software module): | |||||||||||||||||||||||||||||||||||||||||
bitmap(file='test1.png') | |||||||||||||||||||||||||||||||||||||||||