Free Statistics
of Irreproducible Research!
Description of Statistical Computation | ||||||||||||||||||||||||||||||
|---|---|---|---|---|---|---|---|---|---|---|---|---|---|---|---|---|---|---|---|---|---|---|---|---|---|---|---|---|---|---|
| Author's title | ||||||||||||||||||||||||||||||
| Author | *The author of this computation has been verified* | |||||||||||||||||||||||||||||
| R Software Module | Ian.Hollidayrwasp_varia1.wasp | |||||||||||||||||||||||||||||
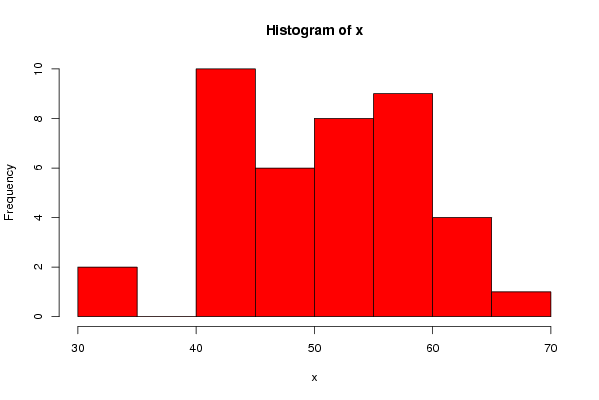
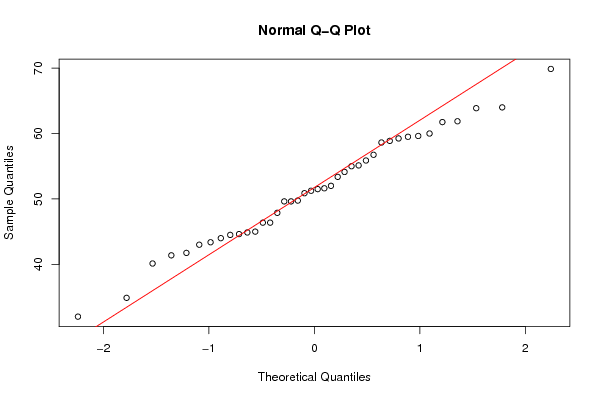
| Title produced by software | Histogram and QQplot | |||||||||||||||||||||||||||||
| Date of computation | Sat, 26 Sep 2009 05:05:56 -0600 | |||||||||||||||||||||||||||||
| Cite this page as follows | Statistical Computations at FreeStatistics.org, Office for Research Development and Education, URL https://freestatistics.org/blog/index.php?v=date/2009/Sep/26/t1253964207pl86i1sgux1khx4.htm/, Retrieved Thu, 25 Apr 2024 07:37:26 +0000 | |||||||||||||||||||||||||||||
| Statistical Computations at FreeStatistics.org, Office for Research Development and Education, URL https://freestatistics.org/blog/index.php?pk=43033, Retrieved Thu, 25 Apr 2024 07:37:26 +0000 | ||||||||||||||||||||||||||||||
| QR Codes: | ||||||||||||||||||||||||||||||
|
| ||||||||||||||||||||||||||||||
| Original text written by user: | this box contains any text | |||||||||||||||||||||||||||||
| IsPrivate? | No (this computation is public) | |||||||||||||||||||||||||||||
| User-defined keywords | PY2224WS1,workshop,brum | |||||||||||||||||||||||||||||
| Estimated Impact | 239 | |||||||||||||||||||||||||||||
Tree of Dependent Computations | ||||||||||||||||||||||||||||||
| Family? (F = Feedback message, R = changed R code, M = changed R Module, P = changed Parameters, D = changed Data) | ||||||||||||||||||||||||||||||
| - [Variability] [Test of Module Varia] [2009-09-18 21:40:19] [74be16979710d4c4e7c6647856088456] - RMP [Histogram and QQplot] [any text goes here] [2009-09-26 11:05:56] [d76b387543b13b5e3afd8ff9e5fdc89f] [Current] - R [Histogram and QQplot] [safari test] [2009-10-06 18:59:19] [74be16979710d4c4e7c6647856088456] | ||||||||||||||||||||||||||||||
| Feedback Forum | ||||||||||||||||||||||||||||||
Post a new message | ||||||||||||||||||||||||||||||
Dataset | ||||||||||||||||||||||||||||||
| Dataseries X: | ||||||||||||||||||||||||||||||
44.875 69.875 56.75 61.875 43.375 40.125 55.125 61.75 54.125 41.75 60 55.875 59.25 46.375 41.375 47.875 49.625 52 55 64 44.5 49.75 53.375 63.875 59.625 45 51.625 46.375 32 59.5 44 49.625 50.875 58.875 51.5 51.25 44.625 58.625 34.875 43 | ||||||||||||||||||||||||||||||
Tables (Output of Computation) | ||||||||||||||||||||||||||||||
| ||||||||||||||||||||||||||||||
Figures (Output of Computation) | ||||||||||||||||||||||||||||||
Input Parameters & R Code | ||||||||||||||||||||||||||||||
| Parameters (Session): | ||||||||||||||||||||||||||||||
| par1 = 10 ; | ||||||||||||||||||||||||||||||
| Parameters (R input): | ||||||||||||||||||||||||||||||
| par1 = 10 ; | ||||||||||||||||||||||||||||||
| R code (references can be found in the software module): | ||||||||||||||||||||||||||||||
bitmap(file='test1.png') | ||||||||||||||||||||||||||||||