Free Statistics
of Irreproducible Research!
Description of Statistical Computation | |||||||||||||||||||||||||||||||||||||||||
|---|---|---|---|---|---|---|---|---|---|---|---|---|---|---|---|---|---|---|---|---|---|---|---|---|---|---|---|---|---|---|---|---|---|---|---|---|---|---|---|---|---|
| Author's title | |||||||||||||||||||||||||||||||||||||||||
| Author | *Unverified author* | ||||||||||||||||||||||||||||||||||||||||
| R Software Module | rwasp_univariatedataseries.wasp | ||||||||||||||||||||||||||||||||||||||||
| Title produced by software | Univariate Data Series | ||||||||||||||||||||||||||||||||||||||||
| Date of computation | Wed, 23 Sep 2009 03:07:55 -0600 | ||||||||||||||||||||||||||||||||||||||||
| Cite this page as follows | Statistical Computations at FreeStatistics.org, Office for Research Development and Education, URL https://freestatistics.org/blog/index.php?v=date/2009/Sep/23/t1253697336adifqp3far734x4.htm/, Retrieved Thu, 25 Apr 2024 12:55:24 +0000 | ||||||||||||||||||||||||||||||||||||||||
| Statistical Computations at FreeStatistics.org, Office for Research Development and Education, URL https://freestatistics.org/blog/index.php?pk=43003, Retrieved Thu, 25 Apr 2024 12:55:24 +0000 | |||||||||||||||||||||||||||||||||||||||||
| QR Codes: | |||||||||||||||||||||||||||||||||||||||||
|
| |||||||||||||||||||||||||||||||||||||||||
| Original text written by user: | |||||||||||||||||||||||||||||||||||||||||
| IsPrivate? | No (this computation is public) | ||||||||||||||||||||||||||||||||||||||||
| User-defined keywords | KDGP1W1 | ||||||||||||||||||||||||||||||||||||||||
| Estimated Impact | 249 | ||||||||||||||||||||||||||||||||||||||||
Tree of Dependent Computations | |||||||||||||||||||||||||||||||||||||||||
| Family? (F = Feedback message, R = changed R code, M = changed R Module, P = changed Parameters, D = changed Data) | |||||||||||||||||||||||||||||||||||||||||
| - [Univariate Data Series] [Gemiddelde consum...] [2009-09-23 09:07:55] [91b501704ec53ded4f914c1fb409b978] [Current] | |||||||||||||||||||||||||||||||||||||||||
| Feedback Forum | |||||||||||||||||||||||||||||||||||||||||
Post a new message | |||||||||||||||||||||||||||||||||||||||||
Dataset | |||||||||||||||||||||||||||||||||||||||||
| Dataseries X: | |||||||||||||||||||||||||||||||||||||||||
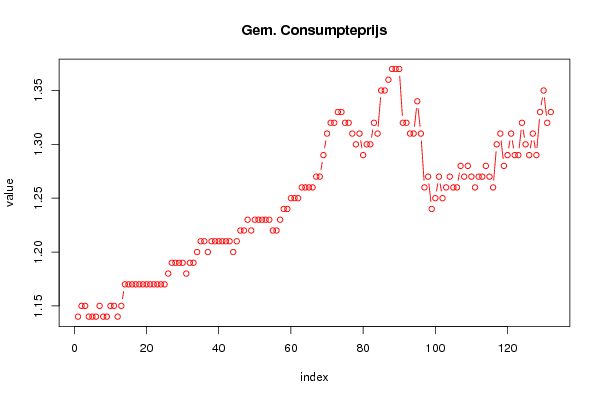
1,14 1,15 1,15 1,14 1,14 1,14 1,15 1,14 1,14 1,15 1,15 1,14 1,15 1,17 1,17 1,17 1,17 1,17 1,17 1,17 1,17 1,17 1,17 1,17 1,17 1,18 1,19 1,19 1,19 1,19 1,18 1,19 1,19 1,2 1,21 1,21 1,2 1,21 1,21 1,21 1,21 1,21 1,21 1,2 1,21 1,22 1,22 1,23 1,22 1,23 1,23 1,23 1,23 1,23 1,22 1,22 1,23 1,24 1,24 1,25 1,25 1,25 1,26 1,26 1,26 1,26 1,27 1,27 1,29 1,31 1,32 1,32 1,33 1,33 1,32 1,32 1,31 1,3 1,31 1,29 1,3 1,3 1,32 1,31 1,35 1,35 1,36 1,37 1,37 1,37 1,32 1,32 1,31 1,31 1,34 1,31 1,26 1,27 1,24 1,25 1,27 1,25 1,26 1,27 1,26 1,26 1,28 1,27 1,28 1,27 1,26 1,27 1,27 1,28 1,27 1,26 1,3 1,31 1,28 1,29 1,31 1,29 1,29 1,32 1,3 1,29 1,31 1,29 1,33 1,35 1,32 1,33 | |||||||||||||||||||||||||||||||||||||||||
Tables (Output of Computation) | |||||||||||||||||||||||||||||||||||||||||
| |||||||||||||||||||||||||||||||||||||||||
Figures (Output of Computation) | |||||||||||||||||||||||||||||||||||||||||
Input Parameters & R Code | |||||||||||||||||||||||||||||||||||||||||
| Parameters (Session): | |||||||||||||||||||||||||||||||||||||||||
| par1 = Gem. consumptieprijs ; par2 = www.belgostat.be ; par3 = De gemiddelde consumptieprijs van het product cola-limonade ; | |||||||||||||||||||||||||||||||||||||||||
| Parameters (R input): | |||||||||||||||||||||||||||||||||||||||||
| par1 = Gem. consumptieprijs ; par2 = www.belgostat.be ; par3 = De gemiddelde consumptieprijs van het product cola-limonade ; | |||||||||||||||||||||||||||||||||||||||||
| R code (references can be found in the software module): | |||||||||||||||||||||||||||||||||||||||||
bitmap(file='test1.png') | |||||||||||||||||||||||||||||||||||||||||