Free Statistics
of Irreproducible Research!
Description of Statistical Computation | |
|---|---|
| Author's title | |
| Author | *The author of this computation has been verified* |
| R Software Module | Rscript (source code is shown below) |
| Title produced by software | R console |
| Date of computation | Wed, 23 Sep 2009 02:36:28 -0600 |
| Cite this page as follows | Statistical Computations at FreeStatistics.org, Office for Research Development and Education, URL https://freestatistics.org/blog/index.php?v=date/2009/Sep/23/t1253694990h4byo93l551q5o0.htm/, Retrieved Thu, 25 Apr 2024 21:40:03 +0000 |
| Statistical Computations at FreeStatistics.org, Office for Research Development and Education, URL https://freestatistics.org/blog/index.php?pk=43002, Retrieved Thu, 25 Apr 2024 21:40:03 +0000 | |
| QR Codes: | |
|
| |
| Original text written by user: | This example is used in the manual files of the RC package. |
| IsPrivate? | No (this computation is public) |
| User-defined keywords | blogtest |
| Estimated Impact | 244 |
Tree of Dependent Computations | |
| Family? (F = Feedback message, R = changed R code, M = changed R Module, P = changed Parameters, D = changed Data) | |
| - [Bagplot] [test] [2009-08-13 21:20:56] [b98453cac15ba1066b407e146608df68] - RMPD [R console] [correlation test] [2009-09-23 08:36:28] [256f657a32c6b2b7628dddcfa9a822d0] [Current] | |
| Feedback Forum | |
Post a new message | |
Dataset | |
| Dataseries X: | |
0.0752747929419038 0.445012867597297 -0.123412353974473 1.09984481923260 0.120002902259727 1.36647137960826 -1.35053658292852 2.16894717579156 -0.571676764056946 0.336292915277117 -1.51098776061008 -1.39196681381647 -0.0339680161767096 -1.44399716419194 0.814543702256617 -0.115313139566779 0.541166660102328 0.555586494917531 -0.174868135333381 0.817212648403003 -0.483750942196755 -0.354420833135282 -0.788211842330571 -0.769656185529686 0.204979038071055 -0.795822221273572 1.41656318646800 -0.243847320948224 -0.109008084897028 0.465562948143319 1.18222395831435 -0.609463942168565 -0.560405682371226 -0.877882766268052 0.407629172987426 -0.725598552648491 -0.131308106155554 0.731256956837894 0.746977637516748 -1.27504643847720 -0.192726674624296 -0.27403069427519 -0.0575187624922381 -0.512354443577578 -1.15004782006833 0.577958299508744 1.74037188773144 0.361870340013447 0.726991736613092 -1.12680862520773 -0.902879810264574 0.41333714085755 0.796707463193271 -0.286191134765564 -0.148892957435819 0.145797413810037 0.233204495232945 1.6461864974349 -0.208842543780035 -1.30262543024946 0.788044808689377 1.07983243086211 0.0458641388266347 -0.407385023732894 -1.02589445924283 -0.405476373371843 1.82130954019782 0.615786007056339 1.45315085159761 -1.81244690562187 0.857600907203096 0.228121725641797 0.624612557504642 1.56779233183322 -2.3204946869891 1.76288902058181 -0.900647236973285 0.822241751950144 1.22512197076538 -1.01718938316944 -0.610302917569445 -0.69077747281152 -0.160266411347537 -0.978223972565749 0.378246752862298 -2.41424636299287 0.675339440220775 0.633370723422611 -2.53022796005637 -0.399456333779471 -0.265295512565901 1.42100690451811 0.0458909941459843 0.300035309155117 0.0530727065218138 1.23282669412886 1.21213518086334 0.889416378083968 1.29016061145989 -0.345414504444215 | |
Tables (Output of Computation) | |
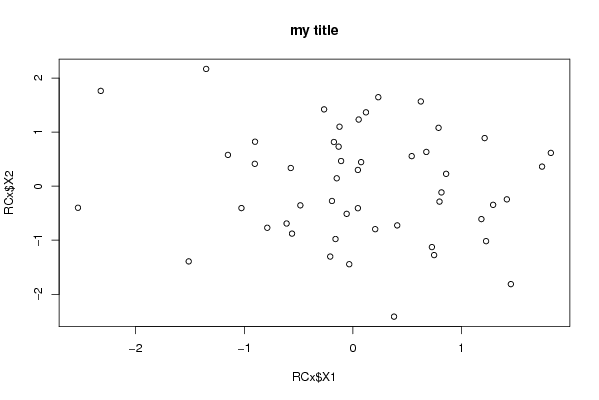
> title = 'my title'


> {
+     plot(RCx$X1, RCx$X2, main = title)
+     res <- cor.test(RCx$X1, RCx$X2)
+     print(res)
+ }

	Pearson's product-moment correlation

data:  RCx$X1 and RCx$X2
t = -1.0078, df = 48, p-value = 0.3186
alternative hypothesis: true correlation is not equal to 0
95 percent confidence interval:
 -0.4060330  0.1400027
sample estimates:
       cor
-0.1439548
| |
Figures (Output of Computation) | |
Input Parameters & R Code | |
| Parameters (Session): | |
| par1 = 'mytitle' ; | |
| Parameters (R input): | |
| R code (body of R function): | |
{ | |