Free Statistics
of Irreproducible Research!
Description of Statistical Computation | |
|---|---|
| Author's title | |
| Author | *The author of this computation has been verified* |
| R Software Module | Rscript (source code is shown below) |
| Title produced by software | R console |
| Date of computation | Mon, 21 Sep 2009 08:50:39 -0600 |
| Cite this page as follows | Statistical Computations at FreeStatistics.org, Office for Research Development and Education, URL https://freestatistics.org/blog/index.php?v=date/2009/Sep/21/t1253544641k60fuqexknjzcjg.htm/, Retrieved Sat, 12 Jul 2025 10:57:23 +0000 |
| Statistical Computations at FreeStatistics.org, Office for Research Development and Education, URL https://freestatistics.org/blog/index.php?pk=42995, Retrieved Sat, 12 Jul 2025 10:57:23 +0000 | |
| QR Codes: | |
|
| |
| Original text written by user: | This example is used in the manual files of the RC package. |
| IsPrivate? | No (this computation is public) |
| User-defined keywords | blogtest |
| Estimated Impact | 327 |
Tree of Dependent Computations | |
| Family? (F = Feedback message, R = changed R code, M = changed R Module, P = changed Parameters, D = changed Data) | |
| - [Bagplot] [test] [2009-08-13 21:20:56] [b98453cac15ba1066b407e146608df68] - RMPD [R console] [correlation test] [2009-09-21 14:50:39] [256f657a32c6b2b7628dddcfa9a822d0] [Current] | |
| Feedback Forum | |
Post a new message | |
Dataset | |
| Dataseries X: | |
1.35189087599901 -0.622088110118824 -0.566468411080608 0.71679736875826 0.136114637249582 -1.72260772875258 -1.60889021489145 -0.354348233673909 -0.256319691028356 0.0962969893932291 0.850981050290253 -0.597114842284736 0.142685701300297 1.21923003181913 0.0394892672463808 -1.24352181918857 -0.353644533984883 0.337713081332371 0.554667361408628 0.377202109495827 0.99434011813343 -0.6872028370034 0.0898163226360073 0.0103572582494155 -0.523760093791296 -1.08133099756507 -1.52849198574237 0.277455390075179 -0.589124611072013 -0.131350616725644 0.368765642573589 1.64767385473548 0.317405902427201 0.410402024155125 -0.253922874516933 0.0877827576564737 -0.325924309447007 -1.08032348764717 1.14048528820151 -1.00699330642326 0.882258968714324 -0.378403856082946 -1.64576499707177 1.0417820641788 -0.725738687359413 -0.239964219643936 -1.36090035629946 1.35529239096776 0.19560574248837 0.961506931793394 0.576452864458798 1.15695572329145 1.81147513282691 0.867545199206145 -0.642804106968244 2.00792696035877 -1.04621367115577 0.522487461183391 -0.215254717407597 0.531932186003732 1.19759231488225 -0.0342001930955341 0.239926213511352 -0.088784213927647 -0.955245922628636 0.133769283555854 0.60801341381242 1.09535665783017 -0.581840176309735 -0.939377492417975 0.80421222112067 -1.72829833094030 -0.24733047245469 0.275834721441129 0.341056139309372 -0.575080488101285 -0.314129525351868 -1.05672930149256 -0.163084766393368 1.16370370266353 1.13072810647593 -2.26632353605663 -0.0287637851685978 0.909307057933644 -2.66846631436895 -1.41242671613422 -0.984702682281832 -0.70156628783552 -0.261089336676020 1.26214319179003 -0.343822900566092 -0.434497472162846 0.91523869538125 -0.582661355702323 0.323083075598611 0.0584214119751105 1.14299723152046 -1.52859663306669 -0.708540487105108 -0.202364920890372 | |
Tables (Output of Computation) | |
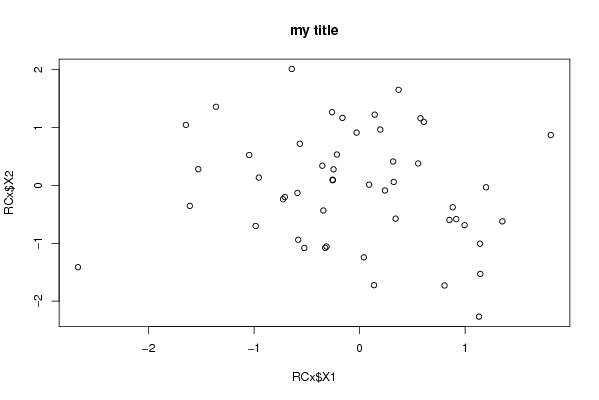
> title = 'my title'


> {
+     plot(RCx$X1, RCx$X2, main = title)
+     res <- cor.test(RCx$X1, RCx$X2)
+     print(res)
+ }

	Pearson's product-moment correlation

data:  RCx$X1 and RCx$X2
t = -1.0008, df = 48, p-value = 0.3219
alternative hypothesis: true correlation is not equal to 0
95 percent confidence interval:
 -0.4051964  0.1409843
sample estimates:
       cor
-0.1429741
| |
Figures (Output of Computation) | |
Input Parameters & R Code | |
| Parameters (Session): | |
| par1 = 'mytitle' ; | |
| Parameters (R input): | |
| R code (body of R function): | |
{ | |