Free Statistics
of Irreproducible Research!
Description of Statistical Computation | |
|---|---|
| Author's title | |
| Author | *The author of this computation has been verified* |
| R Software Module | Rscript (source code is shown below) |
| Title produced by software | R console |
| Date of computation | Mon, 07 Sep 2009 12:34:32 -0600 |
| Cite this page as follows | Statistical Computations at FreeStatistics.org, Office for Research Development and Education, URL https://freestatistics.org/blog/index.php?v=date/2009/Sep/07/t12523484747i7l9ycoiu1i9ro.htm/, Retrieved Thu, 17 Jul 2025 20:28:48 +0000 |
| Statistical Computations at FreeStatistics.org, Office for Research Development and Education, URL https://freestatistics.org/blog/index.php?pk=42979, Retrieved Thu, 17 Jul 2025 20:28:48 +0000 | |
| QR Codes: | |
|
| |
| Original text written by user: | This example is used in the manual files of the RC package. |
| IsPrivate? | No (this computation is public) |
| User-defined keywords | blogtest |
| Estimated Impact | 323 |
Tree of Dependent Computations | |
| Family? (F = Feedback message, R = changed R code, M = changed R Module, P = changed Parameters, D = changed Data) | |
| - [R console] [correlation test] [2009-09-07 18:34:32] [256f657a32c6b2b7628dddcfa9a822d0] [Current] | |
| Feedback Forum | |
Post a new message | |
Dataset | |
| Dataseries X: | |
-0.598573316835919 -1.84194941455738 2.27859088991149 -0.629742239835913 -0.76162914817628 -0.505116464841508 0.273041836855164 -1.34637128532898 -0.435914555691115 -0.930482860765712 0.182638168626448 -0.692856450948986 -1.02919322782168 0.706253173165975 1.03747461142860 -0.527427978923677 -0.291530014712963 0.566843029657609 -1.04055442738878 -1.64869952460676 -2.10162192631557 1.06577609886193 1.43275018316068 0.768753229634819 1.51555356597608 0.201211493298829 0.114335613162356 -0.63071999791331 0.648979405611539 0.0355544912614657 -0.489205223280395 -1.30979647005369 -0.474302087650964 0.464003580447259 1.31236992647838 -0.192368640166484 -0.608908599439891 -0.0939404471975892 0.630557859843633 -1.58353482956374 0.288381358525014 0.206726660803982 -0.382732688509350 2.51220021153644 -1.02553056266241 1.63545005627154 -1.30678108189210 1.45313510514297 -0.613047414331522 0.184005957503141 0.482441089239939 1.80778712776217 -0.591263575751589 1.05383326484965 -1.14082678905706 0.840481309361444 0.336207280615927 -0.123559617304188 0.940821826328216 -1.27063218460487 0.714952258286694 -2.03115911036815 0.565913027285637 -0.423829216096664 1.31277338877366 -0.61219412278302 -1.26481575876535 0.973279373624492 -1.97473017492042 -0.140148821534045 1.17195724967850 0.105504057375305 0.134259271320542 1.41283226110765 -0.345049035043514 0.937820555691204 -0.262634106900167 -0.749166594051148 -0.263748632887754 0.853422534238765 0.160511272127508 0.794117000602206 0.288567868057277 0.517371868886052 0.154379264733928 -0.315534489636360 -0.637041242596933 0.935339916113993 1.34646813124195 2.66525654681069 -2.37182739863252 1.53502749339376 -2.01252213754762 -1.46803812522575 -0.464874101280697 -0.83413000031275 0.835984014292486 -0.527133198344045 -0.0737144198787983 0.849547327397198 | |
Tables (Output of Computation) | |
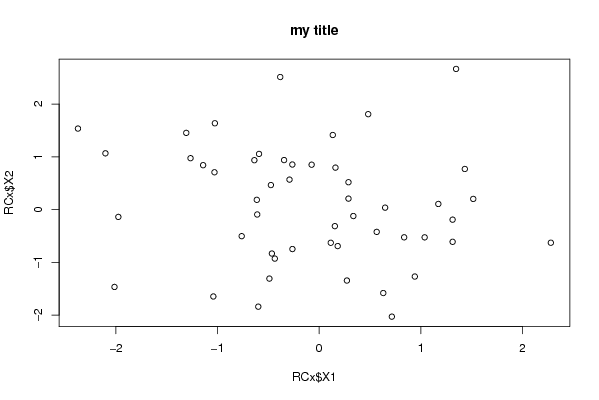
> title = 'my title'


> {
+     plot(RCx$X1, RCx$X2, main = title)
+     res <- cor.test(RCx$X1, RCx$X2)
+     print(res)
+ }

	Pearson's product-moment correlation

data:  RCx$X1 and RCx$X2
t = -1.0975, df = 48, p-value = 0.2779
alternative hypothesis: true correlation is not equal to 0
95 percent confidence interval:
 -0.4166598  0.1274402
sample estimates:
       cor
-0.1564575
| |
Figures (Output of Computation) | |
Input Parameters & R Code | |
| Parameters (Session): | |
| par1 = 'mytitle' ; | |
| Parameters (R input): | |
| R code (body of R function): | |
{ | |