Free Statistics
of Irreproducible Research!
Description of Statistical Computation | |||||||||||||||||||||||||||||||||||||||||
|---|---|---|---|---|---|---|---|---|---|---|---|---|---|---|---|---|---|---|---|---|---|---|---|---|---|---|---|---|---|---|---|---|---|---|---|---|---|---|---|---|---|
| Author's title | |||||||||||||||||||||||||||||||||||||||||
| Author | *The author of this computation has been verified* | ||||||||||||||||||||||||||||||||||||||||
| R Software Module | rwasp_univariatedataseries.wasp | ||||||||||||||||||||||||||||||||||||||||
| Title produced by software | Univariate Data Series | ||||||||||||||||||||||||||||||||||||||||
| Date of computation | Thu, 29 Oct 2009 12:22:35 -0600 | ||||||||||||||||||||||||||||||||||||||||
| Cite this page as follows | Statistical Computations at FreeStatistics.org, Office for Research Development and Education, URL https://freestatistics.org/blog/index.php?v=date/2009/Oct/29/t1256840612ygj8u409e0laa09.htm/, Retrieved Mon, 29 Apr 2024 07:16:25 +0000 | ||||||||||||||||||||||||||||||||||||||||
| Statistical Computations at FreeStatistics.org, Office for Research Development and Education, URL https://freestatistics.org/blog/index.php?pk=52027, Retrieved Mon, 29 Apr 2024 07:16:25 +0000 | |||||||||||||||||||||||||||||||||||||||||
| QR Codes: | |||||||||||||||||||||||||||||||||||||||||
|
| |||||||||||||||||||||||||||||||||||||||||
| Original text written by user: | |||||||||||||||||||||||||||||||||||||||||
| IsPrivate? | No (this computation is public) | ||||||||||||||||||||||||||||||||||||||||
| User-defined keywords | |||||||||||||||||||||||||||||||||||||||||
| Estimated Impact | 212 | ||||||||||||||||||||||||||||||||||||||||
Tree of Dependent Computations | |||||||||||||||||||||||||||||||||||||||||
| Family? (F = Feedback message, R = changed R code, M = changed R Module, P = changed Parameters, D = changed Data) | |||||||||||||||||||||||||||||||||||||||||
| - [Univariate Data Series] [SHW WS5 - Part 1 ...] [2009-10-29 18:22:35] [b7e46d23597387652ca7420fdeb9acca] [Current] - RM D [Univariate Data Series] [e(t) bij eerste m...] [2009-11-02 19:37:47] [1f74ef2f756548f1f3a7b6136ea56d7f] - RMPD [Univariate Data Series] [Eerste model] [2009-11-02 19:56:21] [1f74ef2f756548f1f3a7b6136ea56d7f] - RMPD [Bivariate Explorative Data Analysis] [Model 2] [2009-11-02 20:01:39] [1f74ef2f756548f1f3a7b6136ea56d7f] - RMPD [Univariate Data Series] [Model 2] [2009-11-02 20:20:45] [1f74ef2f756548f1f3a7b6136ea56d7f] - RMPD [Bivariate Explorative Data Analysis] [2 nieuwe variabelen] [2009-11-02 20:26:56] [1f74ef2f756548f1f3a7b6136ea56d7f] - RMPD [Partial Correlation] [] [2009-11-02 20:37:31] [1f74ef2f756548f1f3a7b6136ea56d7f] - M D [Univariate Data Series] [SHW WS5 - e(t) bi...] [2009-11-05 14:10:33] [253127ae8da904b75450fbd69fe4eb21] | |||||||||||||||||||||||||||||||||||||||||
| Feedback Forum | |||||||||||||||||||||||||||||||||||||||||
Post a new message | |||||||||||||||||||||||||||||||||||||||||
Dataset | |||||||||||||||||||||||||||||||||||||||||
| Dataseries X: | |||||||||||||||||||||||||||||||||||||||||
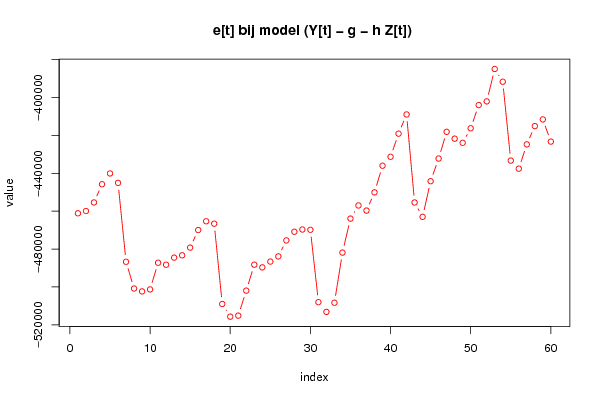
-461099,17 -459893,05 -455365,21 -445744,65 -440056,31 -445025,31 -486687,27 -500818,03 -502335,03 -501278,35 -487209,91 -488265,25 -484502,27 -483283,65 -479223,73 -469934,87 -465306,59 -466595,73 -508995,47 -515677,65 -515143,01 -501928,71 -488224,05 -489648,39 -486587,33 -483851,81 -475427,95 -470840,87 -469668,17 -469805,31 -508038,11 -513156,65 -508324,39 -481845,77 -463901,71 -456958,05 -459665,79 -450053,75 -435965,23 -431246,75 -419044,43 -408896,51 -455390,81 -462958,89 -444153,21 -432191,67 -418067,89 -421685,63 -423870,21 -416194,39 -403944,61 -401993,83 -384867,41 -391609,97 -433264,75 -437537,57 -424708,87 -415056,85 -411524,49 -423229,79 | |||||||||||||||||||||||||||||||||||||||||
Tables (Output of Computation) | |||||||||||||||||||||||||||||||||||||||||
| |||||||||||||||||||||||||||||||||||||||||
Figures (Output of Computation) | |||||||||||||||||||||||||||||||||||||||||
Input Parameters & R Code | |||||||||||||||||||||||||||||||||||||||||
| Parameters (Session): | |||||||||||||||||||||||||||||||||||||||||
| par3 = e[t] bij model (Y[t] - g - h Z[t]) ; | |||||||||||||||||||||||||||||||||||||||||
| Parameters (R input): | |||||||||||||||||||||||||||||||||||||||||
| par1 = ; par2 = ; par3 = e[t] bij model (Y[t] - g - h Z[t]) ; | |||||||||||||||||||||||||||||||||||||||||
| R code (references can be found in the software module): | |||||||||||||||||||||||||||||||||||||||||
bitmap(file='test1.png') | |||||||||||||||||||||||||||||||||||||||||