Free Statistics
of Irreproducible Research!
Description of Statistical Computation | |||||||||||||||||||||||||||||||||||||||||||||||||||||||||||||||||||||||||||||||||||||||||||||||||||
|---|---|---|---|---|---|---|---|---|---|---|---|---|---|---|---|---|---|---|---|---|---|---|---|---|---|---|---|---|---|---|---|---|---|---|---|---|---|---|---|---|---|---|---|---|---|---|---|---|---|---|---|---|---|---|---|---|---|---|---|---|---|---|---|---|---|---|---|---|---|---|---|---|---|---|---|---|---|---|---|---|---|---|---|---|---|---|---|---|---|---|---|---|---|---|---|---|---|---|---|
| Author's title | |||||||||||||||||||||||||||||||||||||||||||||||||||||||||||||||||||||||||||||||||||||||||||||||||||
| Author | *The author of this computation has been verified* | ||||||||||||||||||||||||||||||||||||||||||||||||||||||||||||||||||||||||||||||||||||||||||||||||||
| R Software Module | rwasp_correlation.wasp | ||||||||||||||||||||||||||||||||||||||||||||||||||||||||||||||||||||||||||||||||||||||||||||||||||
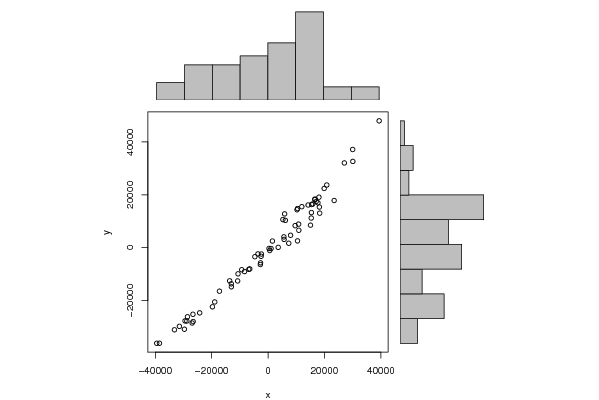
| Title produced by software | Pearson Correlation | ||||||||||||||||||||||||||||||||||||||||||||||||||||||||||||||||||||||||||||||||||||||||||||||||||
| Date of computation | Thu, 29 Oct 2009 10:05:24 -0600 | ||||||||||||||||||||||||||||||||||||||||||||||||||||||||||||||||||||||||||||||||||||||||||||||||||
| Cite this page as follows | Statistical Computations at FreeStatistics.org, Office for Research Development and Education, URL https://freestatistics.org/blog/index.php?v=date/2009/Oct/29/t12568351246ou603wrllffiu3.htm/, Retrieved Mon, 29 Apr 2024 02:46:33 +0000 | ||||||||||||||||||||||||||||||||||||||||||||||||||||||||||||||||||||||||||||||||||||||||||||||||||
| Statistical Computations at FreeStatistics.org, Office for Research Development and Education, URL https://freestatistics.org/blog/index.php?pk=52019, Retrieved Mon, 29 Apr 2024 02:46:33 +0000 | |||||||||||||||||||||||||||||||||||||||||||||||||||||||||||||||||||||||||||||||||||||||||||||||||||
| QR Codes: | |||||||||||||||||||||||||||||||||||||||||||||||||||||||||||||||||||||||||||||||||||||||||||||||||||
|
| |||||||||||||||||||||||||||||||||||||||||||||||||||||||||||||||||||||||||||||||||||||||||||||||||||
| Original text written by user: | |||||||||||||||||||||||||||||||||||||||||||||||||||||||||||||||||||||||||||||||||||||||||||||||||||
| IsPrivate? | No (this computation is public) | ||||||||||||||||||||||||||||||||||||||||||||||||||||||||||||||||||||||||||||||||||||||||||||||||||
| User-defined keywords | |||||||||||||||||||||||||||||||||||||||||||||||||||||||||||||||||||||||||||||||||||||||||||||||||||
| Estimated Impact | 57 | ||||||||||||||||||||||||||||||||||||||||||||||||||||||||||||||||||||||||||||||||||||||||||||||||||
Tree of Dependent Computations | |||||||||||||||||||||||||||||||||||||||||||||||||||||||||||||||||||||||||||||||||||||||||||||||||||
| Family? (F = Feedback message, R = changed R code, M = changed R Module, P = changed Parameters, D = changed Data) | |||||||||||||||||||||||||||||||||||||||||||||||||||||||||||||||||||||||||||||||||||||||||||||||||||
| - [Partial Correlation] [partial correlation] [2009-10-28 19:24:30] [cd6314e7e707a6546bd4604c9d1f2b69] - RMPD [Bivariate Explorative Data Analysis] [relatie vlaandere...] [2009-10-28 19:52:15] [cd6314e7e707a6546bd4604c9d1f2b69] - D [Bivariate Explorative Data Analysis] [bivariate EDA tus...] [2009-10-28 20:45:10] [cd6314e7e707a6546bd4604c9d1f2b69] - RMP [Pearson Correlation] [correlation tusse...] [2009-10-29 16:05:24] [ea241b681aafed79da4b5b99fad98471] [Current] | |||||||||||||||||||||||||||||||||||||||||||||||||||||||||||||||||||||||||||||||||||||||||||||||||||
| Feedback Forum | |||||||||||||||||||||||||||||||||||||||||||||||||||||||||||||||||||||||||||||||||||||||||||||||||||
Post a new message | |||||||||||||||||||||||||||||||||||||||||||||||||||||||||||||||||||||||||||||||||||||||||||||||||||
Dataset | |||||||||||||||||||||||||||||||||||||||||||||||||||||||||||||||||||||||||||||||||||||||||||||||||||
| Dataseries X: | |||||||||||||||||||||||||||||||||||||||||||||||||||||||||||||||||||||||||||||||||||||||||||||||||||
5877.641004 5264.324975 6142.177029 10268.13606 10473.95003 11975.11389 27071.77554 39415.43061 17684.58436 18056.32275 14220.73908 19910.88099 20825.80839 17078.14492 15893.85256 16587.08554 15452.75508 16634.15379 30075.88387 30024.98807 10837.18097 18212.88846 9612.37698 15383.76942 -10793.78215 -2665.770597 -2747.627613 5616.223003 3604.418271 -2472.739559 1060.469578 -8354.360115 -19737.63012 -29682.41175 -31450.81059 -26654.75529 -33207.92652 -38530.07447 -28833.33473 -39506.72592 -28597.11427 -2341.826355 343.2037971 -13047.16234 -26584.87934 -26927.22357 -18923.29632 -13025.37249 -24270.05651 -29451.89576 -10651.68425 -13617.95194 -4687.142289 1547.342007 -3588.856605 -9350.202187 -17243.26871 -6501.430206 -6826.935843 600.2497751 5685.935602 7979.577494 10909.68967 7336.861697 15319.24875 23453.89399 18322.6577 15060.75058 10453.76214 | |||||||||||||||||||||||||||||||||||||||||||||||||||||||||||||||||||||||||||||||||||||||||||||||||||
| Dataseries Y: | |||||||||||||||||||||||||||||||||||||||||||||||||||||||||||||||||||||||||||||||||||||||||||||||||||
12759.67629 10622.97664 10308.72729 14324.40815 14766.20241 15482.80982 32045.46369 47967.4267 16954.41759 19078.51507 16119.42199 22381.18044 23681.8785 17447.24575 16518.34184 18164.67245 16311.81215 18389.41422 32616.54318 37136.81187 8887.473886 15353.85271 8311.578885 13271.94069 -12610.00173 -5753.20383 -6392.730644 4072.838634 97.67948377 -3302.437027 -349.966368 -9077.38537 -22399.95763 -30889.52098 -29794.84033 -25229.06177 -31107.64024 -36194.88959 -27783.31195 -36208.22571 -26169.46189 -2433.81936 -324.3648547 -13694.31753 -27975.766 -28540.55489 -20562.5741 -14825.48688 -24696.80327 -27729.30797 -9923.327593 -12574.73706 -3445.486919 2484.396362 -2379.636843 -8368.905883 -16495.70087 -8069.129444 -8234.645685 -1098.922628 3114.041771 4665.292196 6553.747945 1644.27573 11190.37869 17827.49059 13036.98367 8499.203837 2547.001736 | |||||||||||||||||||||||||||||||||||||||||||||||||||||||||||||||||||||||||||||||||||||||||||||||||||
Tables (Output of Computation) | |||||||||||||||||||||||||||||||||||||||||||||||||||||||||||||||||||||||||||||||||||||||||||||||||||
| |||||||||||||||||||||||||||||||||||||||||||||||||||||||||||||||||||||||||||||||||||||||||||||||||||
Figures (Output of Computation) | |||||||||||||||||||||||||||||||||||||||||||||||||||||||||||||||||||||||||||||||||||||||||||||||||||
Input Parameters & R Code | |||||||||||||||||||||||||||||||||||||||||||||||||||||||||||||||||||||||||||||||||||||||||||||||||||
| Parameters (Session): | |||||||||||||||||||||||||||||||||||||||||||||||||||||||||||||||||||||||||||||||||||||||||||||||||||
| Parameters (R input): | |||||||||||||||||||||||||||||||||||||||||||||||||||||||||||||||||||||||||||||||||||||||||||||||||||
| R code (references can be found in the software module): | |||||||||||||||||||||||||||||||||||||||||||||||||||||||||||||||||||||||||||||||||||||||||||||||||||
bitmap(file='test1.png') | |||||||||||||||||||||||||||||||||||||||||||||||||||||||||||||||||||||||||||||||||||||||||||||||||||