Free Statistics

of Irreproducible Research!

Author's title

Author*The author of this computation has been verified*
R Software Modulerwasp_correlation.wasp
Title produced by softwarePearson Correlation
Date of computationWed, 28 Oct 2009 17:14:28 -0600
Cite this page as followsStatistical Computations at FreeStatistics.org, Office for Research Development and Education, URL https://freestatistics.org/blog/index.php?v=date/2009/Oct/29/t1256771844gdybjphszfru8is.htm/, Retrieved Sun, 28 Apr 2024 20:11:22 +0000
Statistical Computations at FreeStatistics.org, Office for Research Development and Education, URL https://freestatistics.org/blog/index.php?pk=51903, Retrieved Sun, 28 Apr 2024 20:11:22 +0000
QR Codes:

Original text written by user:
IsPrivate?No (this computation is public)
User-defined keywords
Estimated Impact154
Family? (F = Feedback message, R = changed R code, M = changed R Module, P = changed Parameters, D = changed Data)
-       [Pearson Correlation] [correlation] [2009-10-28 23:14:28] [99bf2a1e962091d45abf4c2600a412f9] [Current]
Feedback Forum

Post a new message
Dataseries X:
26672520
28108344
34113075
29226944
21199149
23834985
18699714
18266456
20745146
23902320
20018988
14930930
30402222
26854866
30670512
27827172
23669415
28213865
20335887
20995391
22385060
22664808
21230195
12520284
34721336
32423450
38013200
29601180
29306085
26725293
22136480
20816378
21819660
24500784
19733590
11813970
31486686
27027819
31772636
25302178
24258192
25198003
22232745
19294185
19978120
24429612
18654270
12270208
29611692
28645612
28424901
30527000
22947701
24458304
20927808
17735742
19749786
21905246
15361200
11329296

Dataseries Y:
26672520
28108344
34113075
29226944
21199149
23834985
18699714
18266456
20745146
23902320
20018988
14930930
30402222
26854866
30670512
27827172
23669415
28213865
20335887
20995391
22385060
22664808
21230195
12520284
34721336
32423450
38013200
29601180
29306085
26725293
22136480
20816378
21819660
24500784
19733590
11813970
31486686
27027819
31772636
25302178
24258192
25198003
22232745
19294185
19978120
24429612
18654270
12270208
29611692
28645612
28424901
30527000
22947701
24458304
20927808
17735742
19749786
21905246
15361200
11329296


Summary of computational transaction
Raw Inputview raw input (R code)
Raw Outputview raw output of R engine
Computing time1 seconds
R Server'George Udny Yule' @ 72.249.76.132
R Framework error message
Warning: there are blank lines in the 'Data X' field.
Please, use NA for missing data - blank lines are simply
 deleted and are NOT treated as missing values.

\begin{tabular}{lllllllll}
\hline
Summary of computational transaction \tabularnewline
Raw Input & view raw input (R code)  \tabularnewline
Raw Output & view raw output of R engine  \tabularnewline
Computing time & 1 seconds \tabularnewline
R Server & 'George Udny Yule' @ 72.249.76.132 \tabularnewline
R Framework error message & 
Warning: there are blank lines in the 'Data X' field.
Please, use NA for missing data - blank lines are simply
 deleted and are NOT treated as missing values.
\tabularnewline \hline \end{tabular} %Source: https://freestatistics.org/blog/index.php?pk=51903&T=0

[TABLE]
[ROW][C]Summary of computational transaction[/C][/ROW]
[ROW][C]Raw Input[/C][C]view raw input (R code) [/C][/ROW]
[ROW][C]Raw Output[/C][C]view raw output of R engine [/C][/ROW]
[ROW][C]Computing time[/C][C]1 seconds[/C][/ROW]
[ROW][C]R Server[/C][C]'George Udny Yule' @ 72.249.76.132[/C][/ROW]
[ROW][C]R Framework error message[/C][C]
Warning: there are blank lines in the 'Data X' field.
Please, use NA for missing data - blank lines are simply
 deleted and are NOT treated as missing values.
[/C][/ROW] [/TABLE] Source: https://freestatistics.org/blog/index.php?pk=51903&T=0

Globally Unique Identifier (entire table): ba.freestatistics.org/blog/index.php?pk=51903&T=0

As an alternative you can also use a QR Code:  

The GUIDs for individual cells are displayed in the table below:

Summary of computational transaction
Raw Inputview raw input (R code)
Raw Outputview raw output of R engine
Computing time1 seconds
R Server'George Udny Yule' @ 72.249.76.132
R Framework error message
Warning: there are blank lines in the 'Data X' field.
Please, use NA for missing data - blank lines are simply
 deleted and are NOT treated as missing values.


Pearson Product Moment Correlation - Ungrouped Data
StatisticVariable XVariable Y
Mean23877143.266666723877143.2666667
Biased Variance33612309495027.833612309495027.8
Biased Standard Deviation5797612.396066835797612.39606683
Covariance34182009655960.5
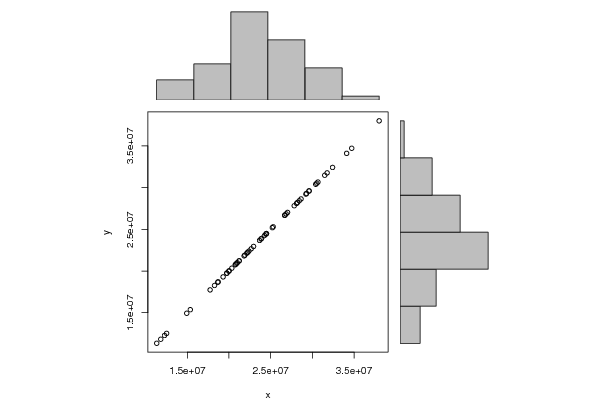
Correlation1
Determination1
T-Test511085881.616279
p-value (2 sided)0
p-value (1 sided)0
Degrees of Freedom58
Number of Observations60

\begin{tabular}{lllllllll}
\hline
Pearson Product Moment Correlation - Ungrouped Data \tabularnewline
Statistic & Variable X & Variable Y \tabularnewline
Mean & 23877143.2666667 & 23877143.2666667 \tabularnewline
Biased Variance & 33612309495027.8 & 33612309495027.8 \tabularnewline
Biased Standard Deviation & 5797612.39606683 & 5797612.39606683 \tabularnewline
Covariance & 34182009655960.5 \tabularnewline
Correlation & 1 \tabularnewline
Determination & 1 \tabularnewline
T-Test & 511085881.616279 \tabularnewline
p-value (2 sided) & 0 \tabularnewline
p-value (1 sided) & 0 \tabularnewline
Degrees of Freedom & 58 \tabularnewline
Number of Observations & 60 \tabularnewline
\hline
\end{tabular}
%Source: https://freestatistics.org/blog/index.php?pk=51903&T=1

[TABLE]
[ROW][C]Pearson Product Moment Correlation - Ungrouped Data[/C][/ROW]
[ROW][C]Statistic[/C][C]Variable X[/C][C]Variable Y[/C][/ROW]
[ROW][C]Mean[/C][C]23877143.2666667[/C][C]23877143.2666667[/C][/ROW]
[ROW][C]Biased Variance[/C][C]33612309495027.8[/C][C]33612309495027.8[/C][/ROW]
[ROW][C]Biased Standard Deviation[/C][C]5797612.39606683[/C][C]5797612.39606683[/C][/ROW]
[ROW][C]Covariance[/C][C]34182009655960.5[/C][/ROW]
[ROW][C]Correlation[/C][C]1[/C][/ROW]
[ROW][C]Determination[/C][C]1[/C][/ROW]
[ROW][C]T-Test[/C][C]511085881.616279[/C][/ROW]
[ROW][C]p-value (2 sided)[/C][C]0[/C][/ROW]
[ROW][C]p-value (1 sided)[/C][C]0[/C][/ROW]
[ROW][C]Degrees of Freedom[/C][C]58[/C][/ROW]
[ROW][C]Number of Observations[/C][C]60[/C][/ROW]
[/TABLE]
Source: https://freestatistics.org/blog/index.php?pk=51903&T=1

Globally Unique Identifier (entire table): ba.freestatistics.org/blog/index.php?pk=51903&T=1

As an alternative you can also use a QR Code:  

The GUIDs for individual cells are displayed in the table below:

Pearson Product Moment Correlation - Ungrouped Data
StatisticVariable XVariable Y
Mean23877143.266666723877143.2666667
Biased Variance33612309495027.833612309495027.8
Biased Standard Deviation5797612.396066835797612.39606683
Covariance34182009655960.5
Correlation1
Determination1
T-Test511085881.616279
p-value (2 sided)0
p-value (1 sided)0
Degrees of Freedom58
Number of Observations60


Parameters (Session):
Parameters (R input):
R code (references can be found in the software module):
bitmap(file='test1.png')
histx <- hist(x, plot=FALSE)
histy <- hist(y, plot=FALSE)
maxcounts <- max(c(histx$counts, histx$counts))
xrange <- c(min(x),max(x))
yrange <- c(min(y),max(y))
nf <- layout(matrix(c(2,0,1,3),2,2,byrow=TRUE), c(3,1), c(1,3), TRUE)
par(mar=c(4,4,1,1))
plot(x, y, xlim=xrange, ylim=yrange, xlab=xlab, ylab=ylab)
par(mar=c(0,4,1,1))
barplot(histx$counts, axes=FALSE, ylim=c(0, maxcounts), space=0)
par(mar=c(4,0,1,1))
barplot(histy$counts, axes=FALSE, xlim=c(0, maxcounts), space=0, horiz=TRUE)
dev.off()
lx = length(x)
makebiased = (lx-1)/lx
varx = var(x)*makebiased
vary = var(y)*makebiased
corxy <- cor.test(x,y,method='pearson')
cxy <- as.matrix(corxy$estimate)[1,1]
load(file='createtable')
a<-table.start()
a<-table.row.start(a)
a<-table.element(a,'Pearson Product Moment Correlation - Ungrouped Data',3,TRUE)
a<-table.row.end(a)
a<-table.row.start(a)
a<-table.element(a,'Statistic',1,TRUE)
a<-table.element(a,'Variable X',1,TRUE)
a<-table.element(a,'Variable Y',1,TRUE)
a<-table.row.end(a)
a<-table.row.start(a)
a<-table.element(a,hyperlink('arithmetic_mean.htm','Mean',''),header=TRUE)
a<-table.element(a,mean(x))
a<-table.element(a,mean(y))
a<-table.row.end(a)
a<-table.row.start(a)
a<-table.element(a,hyperlink('biased.htm','Biased Variance',''),header=TRUE)
a<-table.element(a,varx)
a<-table.element(a,vary)
a<-table.row.end(a)
a<-table.row.start(a)
a<-table.element(a,hyperlink('biased1.htm','Biased Standard Deviation',''),header=TRUE)
a<-table.element(a,sqrt(varx))
a<-table.element(a,sqrt(vary))
a<-table.row.end(a)
a<-table.row.start(a)
a<-table.element(a,hyperlink('covariance.htm','Covariance',''),header=TRUE)
a<-table.element(a,cov(x,y),2)
a<-table.row.end(a)
a<-table.row.start(a)
a<-table.element(a,hyperlink('pearson_correlation.htm','Correlation',''),header=TRUE)
a<-table.element(a,cxy,2)
a<-table.row.end(a)
a<-table.row.start(a)
a<-table.element(a,hyperlink('coeff_of_determination.htm','Determination',''),header=TRUE)
a<-table.element(a,cxy*cxy,2)
a<-table.row.end(a)
a<-table.row.start(a)
a<-table.element(a,hyperlink('ttest_statistic.htm','T-Test',''),header=TRUE)
a<-table.element(a,as.matrix(corxy$statistic)[1,1],2)
a<-table.row.end(a)
a<-table.row.start(a)
a<-table.element(a,'p-value (2 sided)',header=TRUE)
a<-table.element(a,(p2 <- as.matrix(corxy$p.value)[1,1]),2)
a<-table.row.end(a)
a<-table.row.start(a)
a<-table.element(a,'p-value (1 sided)',header=TRUE)
a<-table.element(a,p2/2,2)
a<-table.row.end(a)
a<-table.row.start(a)
a<-table.element(a,'Degrees of Freedom',header=TRUE)
a<-table.element(a,lx-2,2)
a<-table.row.end(a)
a<-table.row.start(a)
a<-table.element(a,'Number of Observations',header=TRUE)
a<-table.element(a,lx,2)
a<-table.row.end(a)
a<-table.end(a)
table.save(a,file='mytable.tab')