Free Statistics

of Irreproducible Research!

Author's title

Author*The author of this computation has been verified*
R Software Modulerwasp_edabi.wasp
Title produced by softwareBivariate Explorative Data Analysis
Date of computationWed, 28 Oct 2009 15:55:12 -0600
Cite this page as followsStatistical Computations at FreeStatistics.org, Office for Research Development and Education, URL https://freestatistics.org/blog/index.php?v=date/2009/Oct/28/t1256767020z40uq4d0ttfphiq.htm/, Retrieved Mon, 06 May 2024 05:59:22 +0000
Statistical Computations at FreeStatistics.org, Office for Research Development and Education, URL https://freestatistics.org/blog/index.php?pk=51874, Retrieved Mon, 06 May 2024 05:59:22 +0000
QR Codes:

Original text written by user:
IsPrivate?No (this computation is public)
User-defined keywords
Estimated Impact122
Family? (F = Feedback message, R = changed R code, M = changed R Module, P = changed Parameters, D = changed Data)
-       [Bivariate Explorative Data Analysis] [ws4 part2] [2009-10-28 21:55:12] [b243db81ea3e1f02fb3382887fb0f701] [Current]
Feedback Forum

Post a new message
Dataseries X:
874444041
910047889
931714576
960752016
963047089
973315204
957097969
1001659201
1096603225
1163219236
1150973476
1114357924
1079188201
1085570704
1304076544
1304148769
1239744100
1238547249
1182190689
1249551801
1373295364
1449781776
1341756900
1299242025
1270067044
1232992996
1257766225
1242844516
1246019401
1289959056
1345642489
1390394944
1485023296
1519206529
1325469649
1221852025
1221572401
1067982400
1210413681
1168135684
1239955369
1215986641
1246019401
1256206249
1377003664
1326343561
1188249841
1147041424
1182328225
1131851449
1199029129
1083660561
1260250000
1303932100
1375371396
1422119521
1634342329
1590733456
1483174144
1502880289
Dataseries Y:
31292836
31192225
32604100
30371121
29192409
33942276
34621456
35581225
35521600
36772096
36554116
35450116
35426304
35521600
35796289
35952016
36252441
37136836
38464804
39388176
39765636
40220964
40259025
40043584
38328481
39200121
39100009
38415204
39025009
39601849
40717161
41576704
41860900
42458256
42667024
42588676
42680089
42224004
42341049
41783296
41641209
41835024
42211009
46348864
46144849
47706649
46131264
45657049
45346756
44275716
43414921
41847961
42523441
41576704
41088100
42614784
41538025
41705764
38626225
38031889


Summary of computational transaction
Raw Inputview raw input (R code)
Raw Outputview raw output of R engine
Computing time2 seconds
R Server'Gwilym Jenkins' @ 72.249.127.135

\begin{tabular}{lllllllll}
\hline
Summary of computational transaction \tabularnewline
Raw Input & view raw input (R code)  \tabularnewline
Raw Output & view raw output of R engine  \tabularnewline
Computing time & 2 seconds \tabularnewline
R Server & 'Gwilym Jenkins' @ 72.249.127.135 \tabularnewline
\hline
\end{tabular}
%Source: https://freestatistics.org/blog/index.php?pk=51874&T=0

[TABLE]
[ROW][C]Summary of computational transaction[/C][/ROW]
[ROW][C]Raw Input[/C][C]view raw input (R code) [/C][/ROW]
[ROW][C]Raw Output[/C][C]view raw output of R engine [/C][/ROW]
[ROW][C]Computing time[/C][C]2 seconds[/C][/ROW]
[ROW][C]R Server[/C][C]'Gwilym Jenkins' @ 72.249.127.135[/C][/ROW]
[/TABLE]
Source: https://freestatistics.org/blog/index.php?pk=51874&T=0

Globally Unique Identifier (entire table): ba.freestatistics.org/blog/index.php?pk=51874&T=0

As an alternative you can also use a QR Code:  

The GUIDs for individual cells are displayed in the table below:

Summary of computational transaction
Raw Inputview raw input (R code)
Raw Outputview raw output of R engine
Computing time2 seconds
R Server'Gwilym Jenkins' @ 72.249.127.135


Model: Y[t] = c + b X[t] + e[t]
c22766676.8543204
b0.0136139781988532

\begin{tabular}{lllllllll}
\hline
Model: Y[t] = c + b X[t] + e[t] \tabularnewline
c & 22766676.8543204 \tabularnewline
b & 0.0136139781988532 \tabularnewline
\hline
\end{tabular}
%Source: https://freestatistics.org/blog/index.php?pk=51874&T=1

[TABLE]
[ROW][C]Model: Y[t] = c + b X[t] + e[t][/C][/ROW]
[ROW][C]c[/C][C]22766676.8543204[/C][/ROW]
[ROW][C]b[/C][C]0.0136139781988532[/C][/ROW]
[/TABLE]
Source: https://freestatistics.org/blog/index.php?pk=51874&T=1

Globally Unique Identifier (entire table): ba.freestatistics.org/blog/index.php?pk=51874&T=1

As an alternative you can also use a QR Code:  

The GUIDs for individual cells are displayed in the table below:

Model: Y[t] = c + b X[t] + e[t]
c22766676.8543204
b0.0136139781988532


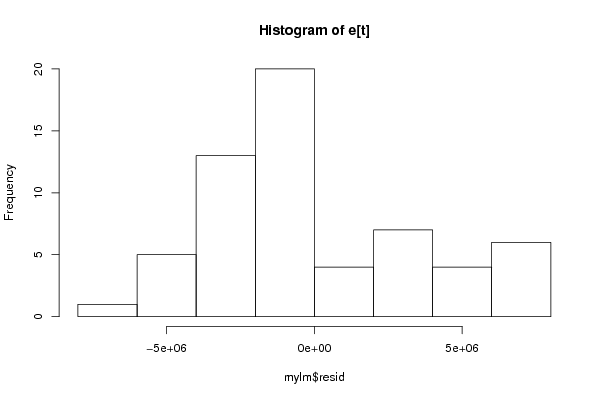
Descriptive Statistics about e[t]
# observations60
minimum-6685169.92843537
Q1-2201409.52566657
median-750301.679599373
mean-4.7371031541843e-10
Q32535385.67390044
maximum7274575.20616215

\begin{tabular}{lllllllll}
\hline
Descriptive Statistics about e[t] \tabularnewline
# observations & 60 \tabularnewline
minimum & -6685169.92843537 \tabularnewline
Q1 & -2201409.52566657 \tabularnewline
median & -750301.679599373 \tabularnewline
mean & -4.7371031541843e-10 \tabularnewline
Q3 & 2535385.67390044 \tabularnewline
maximum & 7274575.20616215 \tabularnewline
\hline
\end{tabular}
%Source: https://freestatistics.org/blog/index.php?pk=51874&T=2

[TABLE]
[ROW][C]Descriptive Statistics about e[t][/C][/ROW]
[ROW][C]# observations[/C][C]60[/C][/ROW]
[ROW][C]minimum[/C][C]-6685169.92843537[/C][/ROW]
[ROW][C]Q1[/C][C]-2201409.52566657[/C][/ROW]
[ROW][C]median[/C][C]-750301.679599373[/C][/ROW]
[ROW][C]mean[/C][C]-4.7371031541843e-10[/C][/ROW]
[ROW][C]Q3[/C][C]2535385.67390044[/C][/ROW]
[ROW][C]maximum[/C][C]7274575.20616215[/C][/ROW]
[/TABLE]
Source: https://freestatistics.org/blog/index.php?pk=51874&T=2

Globally Unique Identifier (entire table): ba.freestatistics.org/blog/index.php?pk=51874&T=2

As an alternative you can also use a QR Code:  

The GUIDs for individual cells are displayed in the table below:

Descriptive Statistics about e[t]
# observations60
minimum-6685169.92843537
Q1-2201409.52566657
median-750301.679599373
mean-4.7371031541843e-10
Q32535385.67390044
maximum7274575.20616215


Parameters (Session):
par1 = 0 ; par2 = 36 ;
Parameters (R input):
par1 = 0 ; par2 = 36 ;
R code (references can be found in the software module):
par1 <- as.numeric(par1)
par2 <- as.numeric(par2)
x <- as.ts(x)
y <- as.ts(y)
mylm <- lm(y~x)
cbind(mylm$resid)
library(lattice)
bitmap(file='pic1.png')
plot(y,type='l',main='Run Sequence Plot of Y[t]',xlab='time or index',ylab='value')
grid()
dev.off()
bitmap(file='pic1a.png')
plot(x,type='l',main='Run Sequence Plot of X[t]',xlab='time or index',ylab='value')
grid()
dev.off()
bitmap(file='pic1b.png')
plot(x,y,main='Scatter Plot',xlab='X[t]',ylab='Y[t]')
grid()
dev.off()
bitmap(file='pic1c.png')
plot(mylm$resid,type='l',main='Run Sequence Plot of e[t]',xlab='time or index',ylab='value')
grid()
dev.off()
bitmap(file='pic2.png')
hist(mylm$resid,main='Histogram of e[t]')
dev.off()
bitmap(file='pic3.png')
if (par1 > 0)
{
densityplot(~mylm$resid,col='black',main=paste('Density Plot of e[t] bw = ',par1),bw=par1)
} else {
densityplot(~mylm$resid,col='black',main='Density Plot of e[t]')
}
dev.off()
bitmap(file='pic4.png')
qqnorm(mylm$resid,main='QQ plot of e[t]')
qqline(mylm$resid)
grid()
dev.off()
if (par2 > 0)
{
bitmap(file='pic5.png')
acf(mylm$resid,lag.max=par2,main='Residual Autocorrelation Function')
grid()
dev.off()
}
summary(x)
load(file='createtable')
a<-table.start()
a<-table.row.start(a)
a<-table.element(a,'Model: Y[t] = c + b X[t] + e[t]',2,TRUE)
a<-table.row.end(a)
a<-table.row.start(a)
a<-table.element(a,'c',1,TRUE)
a<-table.element(a,mylm$coeff[[1]])
a<-table.row.end(a)
a<-table.row.start(a)
a<-table.element(a,'b',1,TRUE)
a<-table.element(a,mylm$coeff[[2]])
a<-table.row.end(a)
a<-table.end(a)
table.save(a,file='mytable.tab')
a<-table.start()
a<-table.row.start(a)
a<-table.element(a,'Descriptive Statistics about e[t]',2,TRUE)
a<-table.row.end(a)
a<-table.row.start(a)
a<-table.element(a,'# observations',header=TRUE)
a<-table.element(a,length(mylm$resid))
a<-table.row.end(a)
a<-table.row.start(a)
a<-table.element(a,'minimum',header=TRUE)
a<-table.element(a,min(mylm$resid))
a<-table.row.end(a)
a<-table.row.start(a)
a<-table.element(a,'Q1',header=TRUE)
a<-table.element(a,quantile(mylm$resid,0.25))
a<-table.row.end(a)
a<-table.row.start(a)
a<-table.element(a,'median',header=TRUE)
a<-table.element(a,median(mylm$resid))
a<-table.row.end(a)
a<-table.row.start(a)
a<-table.element(a,'mean',header=TRUE)
a<-table.element(a,mean(mylm$resid))
a<-table.row.end(a)
a<-table.row.start(a)
a<-table.element(a,'Q3',header=TRUE)
a<-table.element(a,quantile(mylm$resid,0.75))
a<-table.row.end(a)
a<-table.row.start(a)
a<-table.element(a,'maximum',header=TRUE)
a<-table.element(a,max(mylm$resid))
a<-table.row.end(a)
a<-table.end(a)
table.save(a,file='mytable.tab')