Free Statistics

of Irreproducible Research!

Author's title

Author*The author of this computation has been verified*
R Software Modulerwasp_linear_regression.wasp
Title produced by softwareLinear Regression Graphical Model Validation
Date of computationWed, 28 Oct 2009 15:27:29 -0600
Cite this page as followsStatistical Computations at FreeStatistics.org, Office for Research Development and Education, URL https://freestatistics.org/blog/index.php?v=date/2009/Oct/28/t1256765464tvmbi8szk7gvehq.htm/, Retrieved Mon, 06 May 2024 00:30:48 +0000
Statistical Computations at FreeStatistics.org, Office for Research Development and Education, URL https://freestatistics.org/blog/index.php?pk=51853, Retrieved Mon, 06 May 2024 00:30:48 +0000
QR Codes:

Original text written by user:
IsPrivate?No (this computation is public)
User-defined keywords
Estimated Impact85
Family? (F = Feedback message, R = changed R code, M = changed R Module, P = changed Parameters, D = changed Data)
-       [Linear Regression Graphical Model Validation] [Workshop 2 part 2] [2009-10-28 21:27:29] [aef022288383377281176d9807aba5bf] [Current]
Feedback Forum

Post a new message
Dataseries X:
100.64
100.63
100.43
100.8
101.33
101.88
101.85
102.04
102.22
102.63
102.65
102.54
102.37
102.68
102.76
102.82
103.31
103.23
103.6
103.95
103.93
104.25
104.38
104.36
104.32
104.58
104.68
104.92
105.46
105.23
105.58
105.34
105.28
105.7
105.67
105.71
106.19
106.93
107.44
107.85
108.71
109.32
109.49
110.2
110.62
111.22
110.88
111.15
111.29
111.09
111.24
111.45
111.75
111.07
111.17
110.96
110.5
110.48
110.66
110.46
Dataseries Y:
100.2538462
100.0239608
99.56625255
99.75201277
100.5759396
101.3196372
101.809981
101.9178038
102.3557412
103.1810431
103.3608139
103.7120744
103.5040224
103.1304701
103.0095534
103.0088659
103.413251
103.4141677
104.059928
104.4859174
104.4661465
104.8624797
104.9909901
104.4112192
104.0316776
104.2886983
104.4675524
104.3248023
104.9186145
105.17125
105.7772394
105.7599895
105.8006771
106.2758644
106.0462081
106.2057498
106.8402495
108.09177
108.1759259
108.6412278
109.3313732
110.3143833
110.6424353
111.9042995
112.7194868
113.2926114
112.2565075
112.3434136
111.8018093
110.6641011
110.0323823
110.0399759
110.4965382
109.9043303
110.2631844
110.3155907
110.3608618
110.241091
110.7390284
110.3613202


Summary of computational transaction
Raw Inputview raw input (R code)
Raw Outputview raw output of R engine
Computing time4 seconds
R Server'George Udny Yule' @ 72.249.76.132

\begin{tabular}{lllllllll}
\hline
Summary of computational transaction \tabularnewline
Raw Input & view raw input (R code)  \tabularnewline
Raw Output & view raw output of R engine  \tabularnewline
Computing time & 4 seconds \tabularnewline
R Server & 'George Udny Yule' @ 72.249.76.132 \tabularnewline
\hline
\end{tabular}
%Source: https://freestatistics.org/blog/index.php?pk=51853&T=0

[TABLE]
[ROW][C]Summary of computational transaction[/C][/ROW]
[ROW][C]Raw Input[/C][C]view raw input (R code) [/C][/ROW]
[ROW][C]Raw Output[/C][C]view raw output of R engine [/C][/ROW]
[ROW][C]Computing time[/C][C]4 seconds[/C][/ROW]
[ROW][C]R Server[/C][C]'George Udny Yule' @ 72.249.76.132[/C][/ROW]
[/TABLE]
Source: https://freestatistics.org/blog/index.php?pk=51853&T=0

Globally Unique Identifier (entire table): ba.freestatistics.org/blog/index.php?pk=51853&T=0

As an alternative you can also use a QR Code:  

The GUIDs for individual cells are displayed in the table below:

Summary of computational transaction
Raw Inputview raw input (R code)
Raw Outputview raw output of R engine
Computing time4 seconds
R Server'George Udny Yule' @ 72.249.76.132


Simple Linear Regression
StatisticsEstimateS.D.T-STAT (H0: coeff=0)P-value (two-sided)
constant term-2.089475422409363.02015272819274-0.6918442908215770.491795481831883
slope1.021509528794110.028449215481440035.90642172402030

\begin{tabular}{lllllllll}
\hline
Simple Linear Regression \tabularnewline
Statistics & Estimate & S.D. & T-STAT (H0: coeff=0) & P-value (two-sided) \tabularnewline
constant term & -2.08947542240936 & 3.02015272819274 & -0.691844290821577 & 0.491795481831883 \tabularnewline
slope & 1.02150952879411 & 0.0284492154814400 & 35.9064217240203 & 0 \tabularnewline
\hline
\end{tabular}
%Source: https://freestatistics.org/blog/index.php?pk=51853&T=1

[TABLE]
[ROW][C]Simple Linear Regression[/C][/ROW]
[ROW][C]Statistics[/C][C]Estimate[/C][C]S.D.[/C][C]T-STAT (H0: coeff=0)[/C][C]P-value (two-sided)[/C][/ROW]
[ROW][C]constant term[/C][C]-2.08947542240936[/C][C]3.02015272819274[/C][C]-0.691844290821577[/C][C]0.491795481831883[/C][/ROW]
[ROW][C]slope[/C][C]1.02150952879411[/C][C]0.0284492154814400[/C][C]35.9064217240203[/C][C]0[/C][/ROW]
[/TABLE]
Source: https://freestatistics.org/blog/index.php?pk=51853&T=1

Globally Unique Identifier (entire table): ba.freestatistics.org/blog/index.php?pk=51853&T=1

As an alternative you can also use a QR Code:  

The GUIDs for individual cells are displayed in the table below:

Simple Linear Regression
StatisticsEstimateS.D.T-STAT (H0: coeff=0)P-value (two-sided)
constant term-2.089475422409363.02015272819274-0.6918442908215770.491795481831883
slope1.021509528794110.028449215481440035.90642172402030


Parameters (Session):
par1 = 0 ;
Parameters (R input):
par1 = 0 ;
R code (references can be found in the software module):
par1 <- as.numeric(par1)
library(lattice)
z <- as.data.frame(cbind(x,y))
m <- lm(y~x)
summary(m)
bitmap(file='test1.png')
plot(z,main='Scatterplot, lowess, and regression line')
lines(lowess(z),col='red')
abline(m)
grid()
dev.off()
bitmap(file='test2.png')
m2 <- lm(m$fitted.values ~ x)
summary(m2)
z2 <- as.data.frame(cbind(x,m$fitted.values))
names(z2) <- list('x','Fitted')
plot(z2,main='Scatterplot, lowess, and regression line')
lines(lowess(z2),col='red')
abline(m2)
grid()
dev.off()
bitmap(file='test3.png')
m3 <- lm(m$residuals ~ x)
summary(m3)
z3 <- as.data.frame(cbind(x,m$residuals))
names(z3) <- list('x','Residuals')
plot(z3,main='Scatterplot, lowess, and regression line')
lines(lowess(z3),col='red')
abline(m3)
grid()
dev.off()
bitmap(file='test4.png')
m4 <- lm(m$fitted.values ~ m$residuals)
summary(m4)
z4 <- as.data.frame(cbind(m$residuals,m$fitted.values))
names(z4) <- list('Residuals','Fitted')
plot(z4,main='Scatterplot, lowess, and regression line')
lines(lowess(z4),col='red')
abline(m4)
grid()
dev.off()
bitmap(file='test5.png')
myr <- as.ts(m$residuals)
z5 <- as.data.frame(cbind(lag(myr,1),myr))
names(z5) <- list('Lagged Residuals','Residuals')
plot(z5,main='Lag plot')
m5 <- lm(z5)
summary(m5)
abline(m5)
grid()
dev.off()
bitmap(file='test6.png')
hist(m$residuals,main='Residual Histogram',xlab='Residuals')
dev.off()
bitmap(file='test7.png')
if (par1 > 0)
{
densityplot(~m$residuals,col='black',main=paste('Density Plot bw = ',par1),bw=par1)
} else {
densityplot(~m$residuals,col='black',main='Density Plot')
}
dev.off()
bitmap(file='test8.png')
acf(m$residuals,main='Residual Autocorrelation Function')
dev.off()
bitmap(file='test9.png')
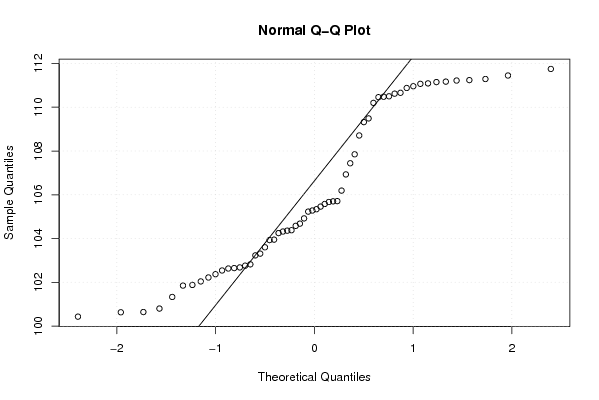
qqnorm(x)
qqline(x)
grid()
dev.off()
load(file='createtable')
a<-table.start()
a<-table.row.start(a)
a<-table.element(a,'Simple Linear Regression',5,TRUE)
a<-table.row.end(a)
a<-table.row.start(a)
a<-table.element(a,'Statistics',1,TRUE)
a<-table.element(a,'Estimate',1,TRUE)
a<-table.element(a,'S.D.',1,TRUE)
a<-table.element(a,'T-STAT (H0: coeff=0)',1,TRUE)
a<-table.element(a,'P-value (two-sided)',1,TRUE)
a<-table.row.end(a)
a<-table.row.start(a)
a<-table.element(a,'constant term',header=TRUE)
a<-table.element(a,m$coefficients[[1]])
sd <- sqrt(vcov(m)[1,1])
a<-table.element(a,sd)
tstat <- m$coefficients[[1]]/sd
a<-table.element(a,tstat)
pval <- 2*(1-pt(abs(tstat),length(x)-2))
a<-table.element(a,pval)
a<-table.row.end(a)
a<-table.row.start(a)
a<-table.element(a,'slope',header=TRUE)
a<-table.element(a,m$coefficients[[2]])
sd <- sqrt(vcov(m)[2,2])
a<-table.element(a,sd)
tstat <- m$coefficients[[2]]/sd
a<-table.element(a,tstat)
pval <- 2*(1-pt(abs(tstat),length(x)-2))
a<-table.element(a,pval)
a<-table.row.end(a)
a<-table.end(a)
table.save(a,file='mytable.tab')