Free Statistics

of Irreproducible Research!

Author's title

Author*The author of this computation has been verified*
R Software Modulerwasp_edabi.wasp
Title produced by softwareBivariate Explorative Data Analysis
Date of computationWed, 28 Oct 2009 15:29:42 -0600
Cite this page as followsStatistical Computations at FreeStatistics.org, Office for Research Development and Education, URL https://freestatistics.org/blog/index.php?v=date/2009/Oct/28/t125676545185thw7v06yxkqx8.htm/, Retrieved Mon, 06 May 2024 05:15:46 +0000
Statistical Computations at FreeStatistics.org, Office for Research Development and Education, URL https://freestatistics.org/blog/index.php?pk=51852, Retrieved Mon, 06 May 2024 05:15:46 +0000
QR Codes:

Original text written by user:
IsPrivate?No (this computation is public)
User-defined keywords
Estimated Impact86
Family? (F = Feedback message, R = changed R code, M = changed R Module, P = changed Parameters, D = changed Data)
-       [Bivariate Explorative Data Analysis] [ws4 part2] [2009-10-28 21:29:42] [b243db81ea3e1f02fb3382887fb0f701] [Current]
Feedback Forum

Post a new message
Dataseries X:
8.629449874
8.627839712
8.649974303
8.614501374
8.594709634
8.670085938
8.679992082
8.693664335
8.69282576
8.710124927
8.707152175
8.691818542
8.691482577
8.69282576
8.696677393
8.698847859
8.703008637
8.71505996
8.7326271
8.744488114
8.74925684
8.754949455
8.75542238
8.752739509
8.730851904
8.742095196
8.740816628
8.731981938
8.739856627
8.747193184
8.761080104
8.771525284
8.774931387
8.78201597
8.784468454
8.783549477
8.784621535
8.779249716
8.780633799
8.7740036
8.772300418
8.774622221
8.779095811
8.82585367
8.823647949
8.840290669
8.823500728
8.818334284
8.8149246
8.802973457
8.793156871
8.774776816
8.782783017
8.771525284
8.76561455
8.783855897
8.771059915
8.773074951
8.734721004
8.726967775
Dataseries Y:
10,29454943
10,31450389
10,32626854
10,34161344
10,34280643
10,34810927
10,33970816
10,36246183
10,40774163
10,4372286
10,43193696
10,41577211
10,39973746
10,40268584
10,4943805
10,49440819
10,46908541
10,46860248
10,44531754
10,47302538
10,52023953
10,54733944
10,50862286
10,49252344
10,48116776
10,46635519
10,47630157
10,47033428
10,47160991
10,48893816
10,51006871
10,52642684
10,55934815
10,57072701
10,50251634
10,4618168
10,46170236
10,39451855
10,45711401
10,43933744
10,46917061
10,45941082
10,47160991
10,47568105
10,52158786
10,5028459
10,44787367
10,43022589
10,4453757
10,42356029
10,452389
10,40180528
10,47728798
10,49432511
10,52099482
10,53770711
10,60725316
10,59373052
10,55872516
10,56532465


Summary of computational transaction
Raw Inputview raw input (R code)
Raw Outputview raw output of R engine
Computing time3 seconds
R Server'Gwilym Jenkins' @ 72.249.127.135

\begin{tabular}{lllllllll}
\hline
Summary of computational transaction \tabularnewline
Raw Input & view raw input (R code)  \tabularnewline
Raw Output & view raw output of R engine  \tabularnewline
Computing time & 3 seconds \tabularnewline
R Server & 'Gwilym Jenkins' @ 72.249.127.135 \tabularnewline
\hline
\end{tabular}
%Source: https://freestatistics.org/blog/index.php?pk=51852&T=0

[TABLE]
[ROW][C]Summary of computational transaction[/C][/ROW]
[ROW][C]Raw Input[/C][C]view raw input (R code) [/C][/ROW]
[ROW][C]Raw Output[/C][C]view raw output of R engine [/C][/ROW]
[ROW][C]Computing time[/C][C]3 seconds[/C][/ROW]
[ROW][C]R Server[/C][C]'Gwilym Jenkins' @ 72.249.127.135[/C][/ROW]
[/TABLE]
Source: https://freestatistics.org/blog/index.php?pk=51852&T=0

Globally Unique Identifier (entire table): ba.freestatistics.org/blog/index.php?pk=51852&T=0

As an alternative you can also use a QR Code:  

The GUIDs for individual cells are displayed in the table below:

Summary of computational transaction
Raw Inputview raw input (R code)
Raw Outputview raw output of R engine
Computing time3 seconds
R Server'Gwilym Jenkins' @ 72.249.127.135


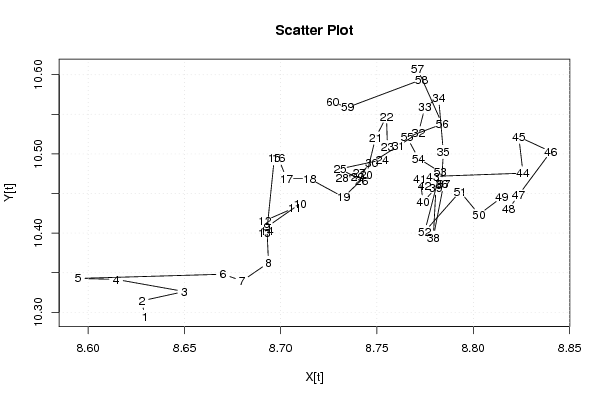
Model: Y[t] = c + b X[t] + e[t]
c3.67067044092913
b0.776638761899102

\begin{tabular}{lllllllll}
\hline
Model: Y[t] = c + b X[t] + e[t] \tabularnewline
c & 3.67067044092913 \tabularnewline
b & 0.776638761899102 \tabularnewline
\hline
\end{tabular}
%Source: https://freestatistics.org/blog/index.php?pk=51852&T=1

[TABLE]
[ROW][C]Model: Y[t] = c + b X[t] + e[t][/C][/ROW]
[ROW][C]c[/C][C]3.67067044092913[/C][/ROW]
[ROW][C]b[/C][C]0.776638761899102[/C][/ROW]
[/TABLE]
Source: https://freestatistics.org/blog/index.php?pk=51852&T=1

Globally Unique Identifier (entire table): ba.freestatistics.org/blog/index.php?pk=51852&T=1

As an alternative you can also use a QR Code:  

The GUIDs for individual cells are displayed in the table below:

Model: Y[t] = c + b X[t] + e[t]
c3.67067044092913
b0.776638761899102


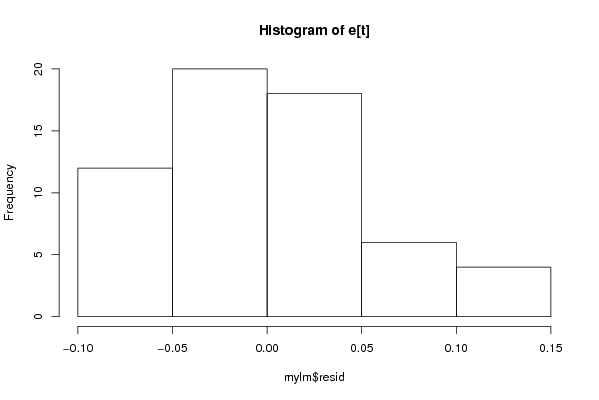
Descriptive Statistics about e[t]
# observations60
minimum-0.0944575207664148
Q1-0.036543779129956
median-0.00235912971760985
mean7.09926547525404e-19
Q30.0359409036420841
maximum0.124637606142426

\begin{tabular}{lllllllll}
\hline
Descriptive Statistics about e[t] \tabularnewline
# observations & 60 \tabularnewline
minimum & -0.0944575207664148 \tabularnewline
Q1 & -0.036543779129956 \tabularnewline
median & -0.00235912971760985 \tabularnewline
mean & 7.09926547525404e-19 \tabularnewline
Q3 & 0.0359409036420841 \tabularnewline
maximum & 0.124637606142426 \tabularnewline
\hline
\end{tabular}
%Source: https://freestatistics.org/blog/index.php?pk=51852&T=2

[TABLE]
[ROW][C]Descriptive Statistics about e[t][/C][/ROW]
[ROW][C]# observations[/C][C]60[/C][/ROW]
[ROW][C]minimum[/C][C]-0.0944575207664148[/C][/ROW]
[ROW][C]Q1[/C][C]-0.036543779129956[/C][/ROW]
[ROW][C]median[/C][C]-0.00235912971760985[/C][/ROW]
[ROW][C]mean[/C][C]7.09926547525404e-19[/C][/ROW]
[ROW][C]Q3[/C][C]0.0359409036420841[/C][/ROW]
[ROW][C]maximum[/C][C]0.124637606142426[/C][/ROW]
[/TABLE]
Source: https://freestatistics.org/blog/index.php?pk=51852&T=2

Globally Unique Identifier (entire table): ba.freestatistics.org/blog/index.php?pk=51852&T=2

As an alternative you can also use a QR Code:  

The GUIDs for individual cells are displayed in the table below:

Descriptive Statistics about e[t]
# observations60
minimum-0.0944575207664148
Q1-0.036543779129956
median-0.00235912971760985
mean7.09926547525404e-19
Q30.0359409036420841
maximum0.124637606142426


Parameters (Session):
par1 = 0 ; par2 = 36 ;
Parameters (R input):
par1 = 0 ; par2 = 36 ;
R code (references can be found in the software module):
par1 <- as.numeric(par1)
par2 <- as.numeric(par2)
x <- as.ts(x)
y <- as.ts(y)
mylm <- lm(y~x)
cbind(mylm$resid)
library(lattice)
bitmap(file='pic1.png')
plot(y,type='l',main='Run Sequence Plot of Y[t]',xlab='time or index',ylab='value')
grid()
dev.off()
bitmap(file='pic1a.png')
plot(x,type='l',main='Run Sequence Plot of X[t]',xlab='time or index',ylab='value')
grid()
dev.off()
bitmap(file='pic1b.png')
plot(x,y,main='Scatter Plot',xlab='X[t]',ylab='Y[t]')
grid()
dev.off()
bitmap(file='pic1c.png')
plot(mylm$resid,type='l',main='Run Sequence Plot of e[t]',xlab='time or index',ylab='value')
grid()
dev.off()
bitmap(file='pic2.png')
hist(mylm$resid,main='Histogram of e[t]')
dev.off()
bitmap(file='pic3.png')
if (par1 > 0)
{
densityplot(~mylm$resid,col='black',main=paste('Density Plot of e[t] bw = ',par1),bw=par1)
} else {
densityplot(~mylm$resid,col='black',main='Density Plot of e[t]')
}
dev.off()
bitmap(file='pic4.png')
qqnorm(mylm$resid,main='QQ plot of e[t]')
qqline(mylm$resid)
grid()
dev.off()
if (par2 > 0)
{
bitmap(file='pic5.png')
acf(mylm$resid,lag.max=par2,main='Residual Autocorrelation Function')
grid()
dev.off()
}
summary(x)
load(file='createtable')
a<-table.start()
a<-table.row.start(a)
a<-table.element(a,'Model: Y[t] = c + b X[t] + e[t]',2,TRUE)
a<-table.row.end(a)
a<-table.row.start(a)
a<-table.element(a,'c',1,TRUE)
a<-table.element(a,mylm$coeff[[1]])
a<-table.row.end(a)
a<-table.row.start(a)
a<-table.element(a,'b',1,TRUE)
a<-table.element(a,mylm$coeff[[2]])
a<-table.row.end(a)
a<-table.end(a)
table.save(a,file='mytable.tab')
a<-table.start()
a<-table.row.start(a)
a<-table.element(a,'Descriptive Statistics about e[t]',2,TRUE)
a<-table.row.end(a)
a<-table.row.start(a)
a<-table.element(a,'# observations',header=TRUE)
a<-table.element(a,length(mylm$resid))
a<-table.row.end(a)
a<-table.row.start(a)
a<-table.element(a,'minimum',header=TRUE)
a<-table.element(a,min(mylm$resid))
a<-table.row.end(a)
a<-table.row.start(a)
a<-table.element(a,'Q1',header=TRUE)
a<-table.element(a,quantile(mylm$resid,0.25))
a<-table.row.end(a)
a<-table.row.start(a)
a<-table.element(a,'median',header=TRUE)
a<-table.element(a,median(mylm$resid))
a<-table.row.end(a)
a<-table.row.start(a)
a<-table.element(a,'mean',header=TRUE)
a<-table.element(a,mean(mylm$resid))
a<-table.row.end(a)
a<-table.row.start(a)
a<-table.element(a,'Q3',header=TRUE)
a<-table.element(a,quantile(mylm$resid,0.75))
a<-table.row.end(a)
a<-table.row.start(a)
a<-table.element(a,'maximum',header=TRUE)
a<-table.element(a,max(mylm$resid))
a<-table.row.end(a)
a<-table.end(a)
table.save(a,file='mytable.tab')