Free Statistics

of Irreproducible Research!

Author's title

Author*The author of this computation has been verified*
R Software Modulerwasp_edabi.wasp
Title produced by softwareBivariate Explorative Data Analysis
Date of computationWed, 28 Oct 2009 15:27:49 -0600
Cite this page as followsStatistical Computations at FreeStatistics.org, Office for Research Development and Education, URL https://freestatistics.org/blog/index.php?v=date/2009/Oct/28/t1256765335ltts1dnk45ulisk.htm/, Retrieved Sun, 05 May 2024 23:35:00 +0000
Statistical Computations at FreeStatistics.org, Office for Research Development and Education, URL https://freestatistics.org/blog/index.php?pk=51848, Retrieved Sun, 05 May 2024 23:35:00 +0000
QR Codes:

Original text written by user:
IsPrivate?No (this computation is public)
User-defined keywords
Estimated Impact91
Family? (F = Feedback message, R = changed R code, M = changed R Module, P = changed Parameters, D = changed Data)
-       [Bivariate Explorative Data Analysis] [shwws4vr2] [2009-10-28 21:27:49] [d447d4b3e35da686436a520338c962fc] [Current]
Feedback Forum

Post a new message
Dataseries X:
10070.1225
10070.1225
10072.1296
10078.1521
10068.1156
10068.1156
10070.1225
10086.1849
10094.2209
10134.4489
10150.5625
10156.6084
10158.6241
10134.4489
10128.4096
10128.4096
10152.5776
10158.6241
10158.6241
10180.81
10196.9604
10223.2321
10237.3924
10245.4884
10247.5129
10219.1881
10253.5876
10257.6384
10288.0449
10308.3409
10310.3716
10310.3716
10361.2041
10440.7524
10479.6169
10498.0516
10498.0516
10410.1209
10457.1076
10471.4289
10493.9536
10506.25
10510.3504
10539.0756
10551.3984
Dataseries Y:
102.1
102.86
102.99
103.73
105.02
104.43
104.63
104.93
105.87
105.66
106.76
106
107.22
107.33
107.11
108.86
107.72
107.88
108.38
107.72
108.41
109.9
111.45
112.18
113.34
113.46
114.06
115.54
116.39
115.94
116.97
115.94
115.91
116.43
116.26
116.35
117.9
117.7
117.53
117.86
117.65
116.51
115.93
115.31
115


Summary of computational transaction
Raw Inputview raw input (R code)
Raw Outputview raw output of R engine
Computing time3 seconds
R Server'Gwilym Jenkins' @ 72.249.127.135

\begin{tabular}{lllllllll}
\hline
Summary of computational transaction \tabularnewline
Raw Input & view raw input (R code)  \tabularnewline
Raw Output & view raw output of R engine  \tabularnewline
Computing time & 3 seconds \tabularnewline
R Server & 'Gwilym Jenkins' @ 72.249.127.135 \tabularnewline
\hline
\end{tabular}
%Source: https://freestatistics.org/blog/index.php?pk=51848&T=0

[TABLE]
[ROW][C]Summary of computational transaction[/C][/ROW]
[ROW][C]Raw Input[/C][C]view raw input (R code) [/C][/ROW]
[ROW][C]Raw Output[/C][C]view raw output of R engine [/C][/ROW]
[ROW][C]Computing time[/C][C]3 seconds[/C][/ROW]
[ROW][C]R Server[/C][C]'Gwilym Jenkins' @ 72.249.127.135[/C][/ROW]
[/TABLE]
Source: https://freestatistics.org/blog/index.php?pk=51848&T=0

Globally Unique Identifier (entire table): ba.freestatistics.org/blog/index.php?pk=51848&T=0

As an alternative you can also use a QR Code:  

The GUIDs for individual cells are displayed in the table below:

Summary of computational transaction
Raw Inputview raw input (R code)
Raw Outputview raw output of R engine
Computing time3 seconds
R Server'Gwilym Jenkins' @ 72.249.127.135


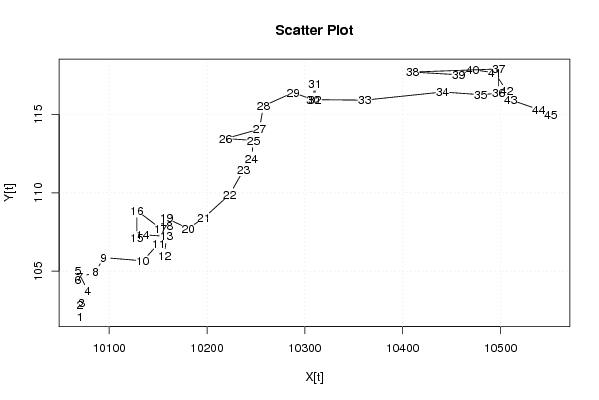
Model: Y[t] = c + b X[t] + e[t]
c-191.666162650508
b0.0295083767988749

\begin{tabular}{lllllllll}
\hline
Model: Y[t] = c + b X[t] + e[t] \tabularnewline
c & -191.666162650508 \tabularnewline
b & 0.0295083767988749 \tabularnewline
\hline
\end{tabular}
%Source: https://freestatistics.org/blog/index.php?pk=51848&T=1

[TABLE]
[ROW][C]Model: Y[t] = c + b X[t] + e[t][/C][/ROW]
[ROW][C]c[/C][C]-191.666162650508[/C][/ROW]
[ROW][C]b[/C][C]0.0295083767988749[/C][/ROW]
[/TABLE]
Source: https://freestatistics.org/blog/index.php?pk=51848&T=1

Globally Unique Identifier (entire table): ba.freestatistics.org/blog/index.php?pk=51848&T=1

As an alternative you can also use a QR Code:  

The GUIDs for individual cells are displayed in the table below:

Model: Y[t] = c + b X[t] + e[t]
c-191.666162650508
b0.0295083767988749


Descriptive Statistics about e[t]
# observations45
minimum-4.68847709173756
Q1-1.31032154254915
median-0.218345050423265
mean5.27163189644063e-17
Q31.51843045480626
maximum4.51990367669994

\begin{tabular}{lllllllll}
\hline
Descriptive Statistics about e[t] \tabularnewline
# observations & 45 \tabularnewline
minimum & -4.68847709173756 \tabularnewline
Q1 & -1.31032154254915 \tabularnewline
median & -0.218345050423265 \tabularnewline
mean & 5.27163189644063e-17 \tabularnewline
Q3 & 1.51843045480626 \tabularnewline
maximum & 4.51990367669994 \tabularnewline
\hline
\end{tabular}
%Source: https://freestatistics.org/blog/index.php?pk=51848&T=2

[TABLE]
[ROW][C]Descriptive Statistics about e[t][/C][/ROW]
[ROW][C]# observations[/C][C]45[/C][/ROW]
[ROW][C]minimum[/C][C]-4.68847709173756[/C][/ROW]
[ROW][C]Q1[/C][C]-1.31032154254915[/C][/ROW]
[ROW][C]median[/C][C]-0.218345050423265[/C][/ROW]
[ROW][C]mean[/C][C]5.27163189644063e-17[/C][/ROW]
[ROW][C]Q3[/C][C]1.51843045480626[/C][/ROW]
[ROW][C]maximum[/C][C]4.51990367669994[/C][/ROW]
[/TABLE]
Source: https://freestatistics.org/blog/index.php?pk=51848&T=2

Globally Unique Identifier (entire table): ba.freestatistics.org/blog/index.php?pk=51848&T=2

As an alternative you can also use a QR Code:  

The GUIDs for individual cells are displayed in the table below:

Descriptive Statistics about e[t]
# observations45
minimum-4.68847709173756
Q1-1.31032154254915
median-0.218345050423265
mean5.27163189644063e-17
Q31.51843045480626
maximum4.51990367669994


Parameters (Session):
par1 = 0 ; par2 = 10 ;
Parameters (R input):
par1 = 0 ; par2 = 10 ;
R code (references can be found in the software module):
par1 <- as.numeric(par1)
par2 <- as.numeric(par2)
x <- as.ts(x)
y <- as.ts(y)
mylm <- lm(y~x)
cbind(mylm$resid)
library(lattice)
bitmap(file='pic1.png')
plot(y,type='l',main='Run Sequence Plot of Y[t]',xlab='time or index',ylab='value')
grid()
dev.off()
bitmap(file='pic1a.png')
plot(x,type='l',main='Run Sequence Plot of X[t]',xlab='time or index',ylab='value')
grid()
dev.off()
bitmap(file='pic1b.png')
plot(x,y,main='Scatter Plot',xlab='X[t]',ylab='Y[t]')
grid()
dev.off()
bitmap(file='pic1c.png')
plot(mylm$resid,type='l',main='Run Sequence Plot of e[t]',xlab='time or index',ylab='value')
grid()
dev.off()
bitmap(file='pic2.png')
hist(mylm$resid,main='Histogram of e[t]')
dev.off()
bitmap(file='pic3.png')
if (par1 > 0)
{
densityplot(~mylm$resid,col='black',main=paste('Density Plot of e[t] bw = ',par1),bw=par1)
} else {
densityplot(~mylm$resid,col='black',main='Density Plot of e[t]')
}
dev.off()
bitmap(file='pic4.png')
qqnorm(mylm$resid,main='QQ plot of e[t]')
qqline(mylm$resid)
grid()
dev.off()
if (par2 > 0)
{
bitmap(file='pic5.png')
acf(mylm$resid,lag.max=par2,main='Residual Autocorrelation Function')
grid()
dev.off()
}
summary(x)
load(file='createtable')
a<-table.start()
a<-table.row.start(a)
a<-table.element(a,'Model: Y[t] = c + b X[t] + e[t]',2,TRUE)
a<-table.row.end(a)
a<-table.row.start(a)
a<-table.element(a,'c',1,TRUE)
a<-table.element(a,mylm$coeff[[1]])
a<-table.row.end(a)
a<-table.row.start(a)
a<-table.element(a,'b',1,TRUE)
a<-table.element(a,mylm$coeff[[2]])
a<-table.row.end(a)
a<-table.end(a)
table.save(a,file='mytable.tab')
a<-table.start()
a<-table.row.start(a)
a<-table.element(a,'Descriptive Statistics about e[t]',2,TRUE)
a<-table.row.end(a)
a<-table.row.start(a)
a<-table.element(a,'# observations',header=TRUE)
a<-table.element(a,length(mylm$resid))
a<-table.row.end(a)
a<-table.row.start(a)
a<-table.element(a,'minimum',header=TRUE)
a<-table.element(a,min(mylm$resid))
a<-table.row.end(a)
a<-table.row.start(a)
a<-table.element(a,'Q1',header=TRUE)
a<-table.element(a,quantile(mylm$resid,0.25))
a<-table.row.end(a)
a<-table.row.start(a)
a<-table.element(a,'median',header=TRUE)
a<-table.element(a,median(mylm$resid))
a<-table.row.end(a)
a<-table.row.start(a)
a<-table.element(a,'mean',header=TRUE)
a<-table.element(a,mean(mylm$resid))
a<-table.row.end(a)
a<-table.row.start(a)
a<-table.element(a,'Q3',header=TRUE)
a<-table.element(a,quantile(mylm$resid,0.75))
a<-table.row.end(a)
a<-table.row.start(a)
a<-table.element(a,'maximum',header=TRUE)
a<-table.element(a,max(mylm$resid))
a<-table.row.end(a)
a<-table.end(a)
table.save(a,file='mytable.tab')