Free Statistics

of Irreproducible Research!

Author's title

Author*The author of this computation has been verified*
R Software Modulerwasp_edabi.wasp
Title produced by softwareBivariate Explorative Data Analysis
Date of computationWed, 28 Oct 2009 13:42:45 -0600
Cite this page as followsStatistical Computations at FreeStatistics.org, Office for Research Development and Education, URL https://freestatistics.org/blog/index.php?v=date/2009/Oct/28/t12567596195049gsuzfuqcclq.htm/, Retrieved Mon, 06 May 2024 08:13:47 +0000
Statistical Computations at FreeStatistics.org, Office for Research Development and Education, URL https://freestatistics.org/blog/index.php?pk=51790, Retrieved Mon, 06 May 2024 08:13:47 +0000
QR Codes:

Original text written by user:
IsPrivate?No (this computation is public)
User-defined keywords
Estimated Impact95
Family? (F = Feedback message, R = changed R code, M = changed R Module, P = changed Parameters, D = changed Data)
-     [Bivariate Data Series] [Bivariate dataset] [2008-01-05 23:51:08] [74be16979710d4c4e7c6647856088456]
F RMPD    [Bivariate Explorative Data Analysis] [WS4P2.1] [2009-10-28 19:42:45] [dd4f17965cad1d38de7a1c062d32d75d] [Current]
Feedback Forum
2009-11-03 22:48:19 [Olivier Thienpont] [reply
Bij part 1 is het toch juist dat je Xt-1 kan nemen.
2009-11-03 22:48:32 [Olivier Thienpont] [reply
Bij part 1 is het toch juist dat je Xt-1 kan nemen.

Post a new message
Dataseries X:
258596
259056
264193
260325
261890
260683
257941
258151
262434
261577
262188
261092
263571
265031
270388
265458
266218
266386
263486
263620
267755
266554
266981
264133
265980
267183
272113
267261
269117
269034
266609
267261
271406
269529
270282
268663
269847
270998
277068
273529
275307
276488
274455
274507
279528
277673
278102
275131
277162
278799
285502
280672
281342
281132
278286
279120
289131
294453
295733
302233
308859
311054
318130
315823
316517
316907
314969
316107
Dataseries Y:
269285
269829
270911
266844
271244
269907
271296
270157
271322
267179
264101
265518
269419
268714
272482
268351
268175
270674
272764
272599
270333
270846
270491
269160
274027
273784
276663
274525
271344
271115
270798
273911
273985
271917
273338
270601
273547
275363
281229
277793
279913
282500
280041
282166
290304
283519
287816
285226
287595
289741
289148
288301
290155
289648
288225
289351
294735
305333
309030
310215
321935
325734
320846
323023
319753
321753
320757
324479


Summary of computational transaction
Raw Inputview raw input (R code)
Raw Outputview raw output of R engine
Computing time3 seconds
R Server'Gwilym Jenkins' @ 72.249.127.135

\begin{tabular}{lllllllll}
\hline
Summary of computational transaction \tabularnewline
Raw Input & view raw input (R code)  \tabularnewline
Raw Output & view raw output of R engine  \tabularnewline
Computing time & 3 seconds \tabularnewline
R Server & 'Gwilym Jenkins' @ 72.249.127.135 \tabularnewline
\hline
\end{tabular}
%Source: https://freestatistics.org/blog/index.php?pk=51790&T=0

[TABLE]
[ROW][C]Summary of computational transaction[/C][/ROW]
[ROW][C]Raw Input[/C][C]view raw input (R code) [/C][/ROW]
[ROW][C]Raw Output[/C][C]view raw output of R engine [/C][/ROW]
[ROW][C]Computing time[/C][C]3 seconds[/C][/ROW]
[ROW][C]R Server[/C][C]'Gwilym Jenkins' @ 72.249.127.135[/C][/ROW]
[/TABLE]
Source: https://freestatistics.org/blog/index.php?pk=51790&T=0

Globally Unique Identifier (entire table): ba.freestatistics.org/blog/index.php?pk=51790&T=0

As an alternative you can also use a QR Code:  

The GUIDs for individual cells are displayed in the table below:

Summary of computational transaction
Raw Inputview raw input (R code)
Raw Outputview raw output of R engine
Computing time3 seconds
R Server'Gwilym Jenkins' @ 72.249.127.135


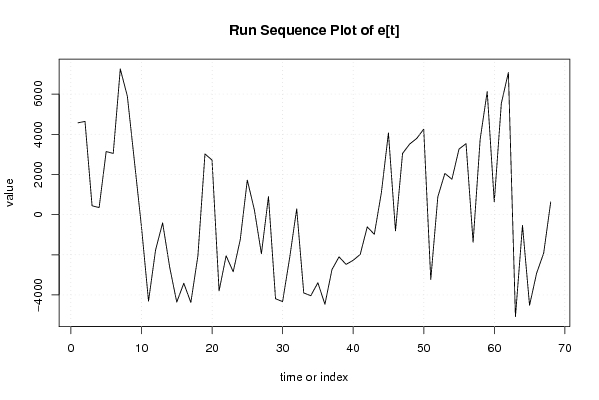
Model: Y[t] = c + b X[t] + e[t]
c-1167.92812513910
b1.02818445276975

\begin{tabular}{lllllllll}
\hline
Model: Y[t] = c + b X[t] + e[t] \tabularnewline
c & -1167.92812513910 \tabularnewline
b & 1.02818445276975 \tabularnewline
\hline
\end{tabular}
%Source: https://freestatistics.org/blog/index.php?pk=51790&T=1

[TABLE]
[ROW][C]Model: Y[t] = c + b X[t] + e[t][/C][/ROW]
[ROW][C]c[/C][C]-1167.92812513910[/C][/ROW]
[ROW][C]b[/C][C]1.02818445276975[/C][/ROW]
[/TABLE]
Source: https://freestatistics.org/blog/index.php?pk=51790&T=1

Globally Unique Identifier (entire table): ba.freestatistics.org/blog/index.php?pk=51790&T=1

As an alternative you can also use a QR Code:  

The GUIDs for individual cells are displayed in the table below:

Model: Y[t] = c + b X[t] + e[t]
c-1167.92812513910
b1.02818445276975


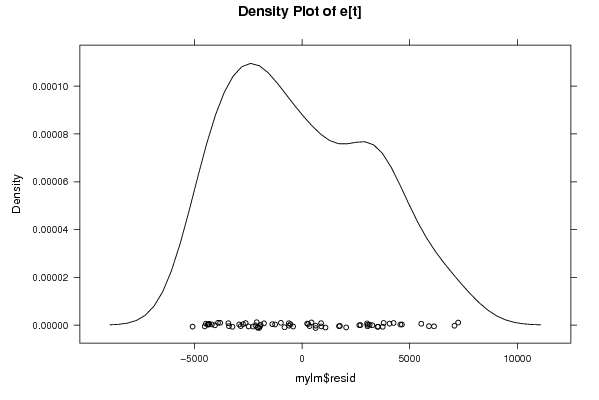
Descriptive Statistics about e[t]
# observations68
minimum-5082.39183450013
Q1-2648.50965801418
median-567.923389486513
mean9.5567344887366e-14
Q33025.7334122292
maximum7253.0021932581

\begin{tabular}{lllllllll}
\hline
Descriptive Statistics about e[t] \tabularnewline
# observations & 68 \tabularnewline
minimum & -5082.39183450013 \tabularnewline
Q1 & -2648.50965801418 \tabularnewline
median & -567.923389486513 \tabularnewline
mean & 9.5567344887366e-14 \tabularnewline
Q3 & 3025.7334122292 \tabularnewline
maximum & 7253.0021932581 \tabularnewline
\hline
\end{tabular}
%Source: https://freestatistics.org/blog/index.php?pk=51790&T=2

[TABLE]
[ROW][C]Descriptive Statistics about e[t][/C][/ROW]
[ROW][C]# observations[/C][C]68[/C][/ROW]
[ROW][C]minimum[/C][C]-5082.39183450013[/C][/ROW]
[ROW][C]Q1[/C][C]-2648.50965801418[/C][/ROW]
[ROW][C]median[/C][C]-567.923389486513[/C][/ROW]
[ROW][C]mean[/C][C]9.5567344887366e-14[/C][/ROW]
[ROW][C]Q3[/C][C]3025.7334122292[/C][/ROW]
[ROW][C]maximum[/C][C]7253.0021932581[/C][/ROW]
[/TABLE]
Source: https://freestatistics.org/blog/index.php?pk=51790&T=2

Globally Unique Identifier (entire table): ba.freestatistics.org/blog/index.php?pk=51790&T=2

As an alternative you can also use a QR Code:  

The GUIDs for individual cells are displayed in the table below:

Descriptive Statistics about e[t]
# observations68
minimum-5082.39183450013
Q1-2648.50965801418
median-567.923389486513
mean9.5567344887366e-14
Q33025.7334122292
maximum7253.0021932581


Parameters (Session):
par1 = 0 ; par2 = 36 ;
Parameters (R input):
par1 = 0 ; par2 = 36 ;
R code (references can be found in the software module):
par1 <- as.numeric(par1)
par2 <- as.numeric(par2)
x <- as.ts(x)
y <- as.ts(y)
mylm <- lm(y~x)
cbind(mylm$resid)
library(lattice)
bitmap(file='pic1.png')
plot(y,type='l',main='Run Sequence Plot of Y[t]',xlab='time or index',ylab='value')
grid()
dev.off()
bitmap(file='pic1a.png')
plot(x,type='l',main='Run Sequence Plot of X[t]',xlab='time or index',ylab='value')
grid()
dev.off()
bitmap(file='pic1b.png')
plot(x,y,main='Scatter Plot',xlab='X[t]',ylab='Y[t]')
grid()
dev.off()
bitmap(file='pic1c.png')
plot(mylm$resid,type='l',main='Run Sequence Plot of e[t]',xlab='time or index',ylab='value')
grid()
dev.off()
bitmap(file='pic2.png')
hist(mylm$resid,main='Histogram of e[t]')
dev.off()
bitmap(file='pic3.png')
if (par1 > 0)
{
densityplot(~mylm$resid,col='black',main=paste('Density Plot of e[t] bw = ',par1),bw=par1)
} else {
densityplot(~mylm$resid,col='black',main='Density Plot of e[t]')
}
dev.off()
bitmap(file='pic4.png')
qqnorm(mylm$resid,main='QQ plot of e[t]')
qqline(mylm$resid)
grid()
dev.off()
if (par2 > 0)
{
bitmap(file='pic5.png')
acf(mylm$resid,lag.max=par2,main='Residual Autocorrelation Function')
grid()
dev.off()
}
summary(x)
load(file='createtable')
a<-table.start()
a<-table.row.start(a)
a<-table.element(a,'Model: Y[t] = c + b X[t] + e[t]',2,TRUE)
a<-table.row.end(a)
a<-table.row.start(a)
a<-table.element(a,'c',1,TRUE)
a<-table.element(a,mylm$coeff[[1]])
a<-table.row.end(a)
a<-table.row.start(a)
a<-table.element(a,'b',1,TRUE)
a<-table.element(a,mylm$coeff[[2]])
a<-table.row.end(a)
a<-table.end(a)
table.save(a,file='mytable.tab')
a<-table.start()
a<-table.row.start(a)
a<-table.element(a,'Descriptive Statistics about e[t]',2,TRUE)
a<-table.row.end(a)
a<-table.row.start(a)
a<-table.element(a,'# observations',header=TRUE)
a<-table.element(a,length(mylm$resid))
a<-table.row.end(a)
a<-table.row.start(a)
a<-table.element(a,'minimum',header=TRUE)
a<-table.element(a,min(mylm$resid))
a<-table.row.end(a)
a<-table.row.start(a)
a<-table.element(a,'Q1',header=TRUE)
a<-table.element(a,quantile(mylm$resid,0.25))
a<-table.row.end(a)
a<-table.row.start(a)
a<-table.element(a,'median',header=TRUE)
a<-table.element(a,median(mylm$resid))
a<-table.row.end(a)
a<-table.row.start(a)
a<-table.element(a,'mean',header=TRUE)
a<-table.element(a,mean(mylm$resid))
a<-table.row.end(a)
a<-table.row.start(a)
a<-table.element(a,'Q3',header=TRUE)
a<-table.element(a,quantile(mylm$resid,0.75))
a<-table.row.end(a)
a<-table.row.start(a)
a<-table.element(a,'maximum',header=TRUE)
a<-table.element(a,max(mylm$resid))
a<-table.row.end(a)
a<-table.end(a)
table.save(a,file='mytable.tab')