Free Statistics

of Irreproducible Research!

Author's title

Author*The author of this computation has been verified*
R Software Modulerwasp_summary1.wasp
Title produced by softwareUnivariate Summary Statistics
Date of computationWed, 28 Oct 2009 12:38:42 -0600
Cite this page as followsStatistical Computations at FreeStatistics.org, Office for Research Development and Education, URL https://freestatistics.org/blog/index.php?v=date/2009/Oct/28/t1256755268mr4su2dcvmi7efp.htm/, Retrieved Sun, 05 May 2024 21:41:50 +0000
Statistical Computations at FreeStatistics.org, Office for Research Development and Education, URL https://freestatistics.org/blog/index.php?pk=51718, Retrieved Sun, 05 May 2024 21:41:50 +0000
QR Codes:

Original text written by user:
IsPrivate?No (this computation is public)
User-defined keywordsRob_WS4_P3
Estimated Impact133
Family? (F = Feedback message, R = changed R code, M = changed R Module, P = changed Parameters, D = changed Data)
-     [Univariate Data Series] [WS2] [2009-10-12 16:56:43] [4f76e114ed5e444b1133aad392380aad]
- RMPD    [Univariate Summary Statistics] [] [2009-10-28 18:38:42] [9002751dd674b8c934bf183fdf4510e9] [Current]
Feedback Forum

Post a new message
Dataseries X:
-6.858089142
-6.869789417
-6.926934049
-6.967988203
-6.89930422
-6.902038349
-6.95283211
-6.967546553
-6.87501809
-6.873399555
-6.909279044
-6.916753994
-6.820709519
-6.794072705
-6.81561224
-6.821630187
-6.71905407
-6.700653595
-6.751288687
-6.767784556
-6.659095839
-6.663099956
-6.728009724
-6.743493163
-6.67347922
-6.666277211
-6.739471379
-6.759054817
-6.680983797
-6.673736211
-6.742859386
-6.755938269
-6.656493813
-6.657810409
-6.720847206
-6.748328185
-6.667590609
-6.680218136
-6.739904386
-6.766062864
-6.678515161
-6.700093753
-6.741037937
-6.76541127
-6.689247362
-6.698197745
-6.75115756
-6.777556771
-6.724676553
-6.749716493
-6.784390935
-6.818229836
-6.765443062
-6.768626791
-6.797062623
-6.814809772
-6.764987886
-6.776582739
-6.81154961
-6.845934066
-6.788754509
-6.809713218
-6.831065966
-6.853437466
-6.785178488
-6.810055528
-6.83293537
-6.861512521
-6.794556614
-6.816492069
-6.833173405
-6.857351964
-6.790295864
-6.808697504
-6.822706812
-6.856742355
-6.785636882
-6.794140125
-6.80140033
-6.828705723
-6.762388538
-6.770598096
-6.792044356
-6.812015702
-6.74572538
-6.739716211
-6.748267115
-6.776309083
-6.713805431
-6.824213913


Summary of computational transaction
Raw Inputview raw input (R code)
Raw Outputview raw output of R engine
Computing time2 seconds
R Server'Gwilym Jenkins' @ 72.249.127.135

\begin{tabular}{lllllllll}
\hline
Summary of computational transaction \tabularnewline
Raw Input & view raw input (R code)  \tabularnewline
Raw Output & view raw output of R engine  \tabularnewline
Computing time & 2 seconds \tabularnewline
R Server & 'Gwilym Jenkins' @ 72.249.127.135 \tabularnewline
\hline
\end{tabular}
%Source: https://freestatistics.org/blog/index.php?pk=51718&T=0

[TABLE]
[ROW][C]Summary of computational transaction[/C][/ROW]
[ROW][C]Raw Input[/C][C]view raw input (R code) [/C][/ROW]
[ROW][C]Raw Output[/C][C]view raw output of R engine [/C][/ROW]
[ROW][C]Computing time[/C][C]2 seconds[/C][/ROW]
[ROW][C]R Server[/C][C]'Gwilym Jenkins' @ 72.249.127.135[/C][/ROW]
[/TABLE]
Source: https://freestatistics.org/blog/index.php?pk=51718&T=0

Globally Unique Identifier (entire table): ba.freestatistics.org/blog/index.php?pk=51718&T=0

As an alternative you can also use a QR Code:  

The GUIDs for individual cells are displayed in the table below:

Summary of computational transaction
Raw Inputview raw input (R code)
Raw Outputview raw output of R engine
Computing time2 seconds
R Server'Gwilym Jenkins' @ 72.249.127.135


Central Tendency - Ungrouped Data
MeasureValueS.E.Value/S.E.
Arithmetic Mean-6.783371081422220.00769456182049757-881.579905349773
Geometric MeanNaN
Harmonic Mean-6.78259699227838
Quadratic Mean6.78375947298683
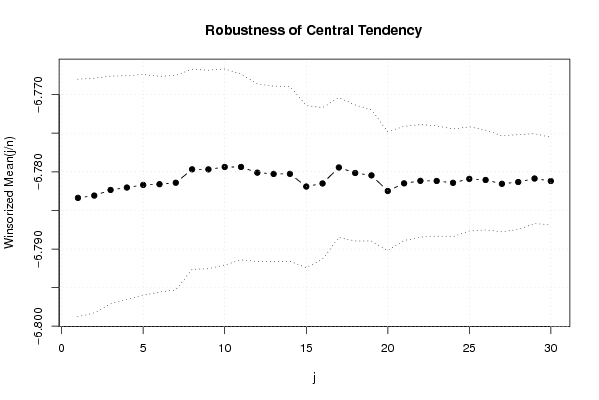
Winsorized Mean ( 1 / 30 )-6.783380803044450.00769054311005296-882.04184099525
Winsorized Mean ( 2 / 30 )-6.783082380533330.0076002673988128-892.479438498819
Winsorized Mean ( 3 / 30 )-6.78235258240.00737227130316142-919.981414613914
Winsorized Mean ( 4 / 30 )-6.782041346844450.00724966594169879-935.497083780833
Winsorized Mean ( 5 / 30 )-6.78169903840.00715159667645488-948.27761480556
Winsorized Mean ( 6 / 30 )-6.781608899466670.0069871250061076-970.58645630910
Winsorized Mean ( 7 / 30 )-6.781416233177780.00694276731059155-976.75983218282
Winsorized Mean ( 8 / 30 )-6.779682261622220.006483307612776-1045.71349480043
Winsorized Mean ( 9 / 30 )-6.779690705622220.00642694095158799-1054.88610471006
Winsorized Mean ( 10 / 30 )-6.779374652622220.00634717132071714-1068.09385001069
Winsorized Mean ( 11 / 30 )-6.779373023277780.00601547299657523-1126.98918724055
Winsorized Mean ( 12 / 30 )-6.780109957144440.00574959978650618-1179.23163505341
Winsorized Mean ( 13 / 30 )-6.78027734370.00568977966601447-1191.65903456669
Winsorized Mean ( 14 / 30 )-6.780269602166670.00566159221670156-1197.59059689340
Winsorized Mean ( 15 / 30 )-6.781910760.00524399209336527-1293.27249912915
Winsorized Mean ( 16 / 30 )-6.78150991360.00490846074562911-1381.59603693251
Winsorized Mean ( 17 / 30 )-6.779438269988890.00452020673309132-1499.80712615604
Winsorized Mean ( 18 / 30 )-6.780156532388890.00440382571262142-1539.60600960135
Winsorized Mean ( 19 / 30 )-6.780465549866670.00425227982362889-1594.54829670175
Winsorized Mean ( 20 / 30 )-6.782488085866670.00384435219986587-1764.27333741776
Winsorized Mean ( 21 / 30 )-6.781497124333330.0036982829827661-1833.68799952165
Winsorized Mean ( 22 / 30 )-6.78117472020.00364494681838690-1860.43173140207
Winsorized Mean ( 23 / 30 )-6.781189267955560.00357312253732489-1897.83283308063
Winsorized Mean ( 24 / 30 )-6.781429476222220.00348104378214645-1948.10232235594
Winsorized Mean ( 25 / 30 )-6.780916724555550.00337261977632449-2010.57847438274
Winsorized Mean ( 26 / 30 )-6.781059565666670.00323064258580956-2098.98166867859
Winsorized Mean ( 27 / 30 )-6.781558137466670.00310532083730339-2183.85103915886
Winsorized Mean ( 28 / 30 )-6.781327480311110.00307236350314065-2207.20219901684
Winsorized Mean ( 29 / 30 )-6.780874512555560.00290916128989884-2330.86922203318
Winsorized Mean ( 30 / 30 )-6.781199504222220.00283294273602106-2393.69452054177
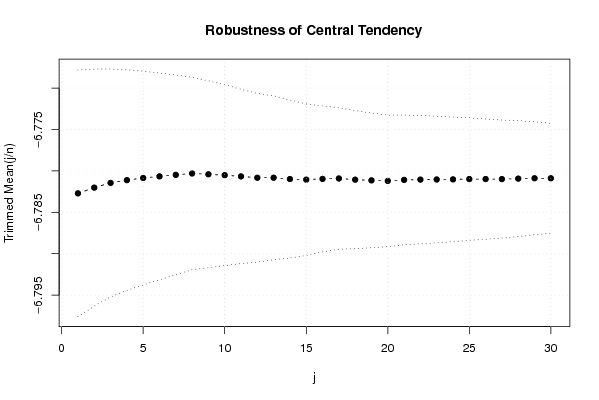
Trimmed Mean ( 1 / 30 )-6.782714946727270.00744207084503349-911.401555825521
Trimmed Mean ( 2 / 30 )-6.782018120348840.00715489637254439-947.884884311336
Trimmed Mean ( 3 / 30 )-6.781447980964290.00687882654686936-985.843724181505
Trimmed Mean ( 4 / 30 )-6.781117029219510.00666126067077302-1017.99304431553
Trimmed Mean ( 5 / 30 )-6.78085706488750.0064524853240268-1050.89073812194
Trimmed Mean ( 6 / 30 )-6.780662763307690.00623929016520405-1086.76829956119
Trimmed Mean ( 7 / 30 )-6.780476025907890.00603473902546282-1123.57402653181
Trimmed Mean ( 8 / 30 )-6.780312669432430.00580549098534674-1167.91373658941
Trimmed Mean ( 9 / 30 )-6.780411170652780.0056421552447752-1201.74133402863
Trimmed Mean ( 10 / 30 )-6.780514094228570.00546111327762911-1241.59923984808
Trimmed Mean ( 11 / 30 )-6.780664902676470.00526244589387968-1288.50064008497
Trimmed Mean ( 12 / 30 )-6.780825053015150.00509297348331487-1331.40788484956
Trimmed Mean ( 13 / 30 )-6.780825053015150.00494207981722341-1372.05899212384
Trimmed Mean ( 14 / 30 )-6.78097936927420.00477143488578134-1421.16146014718
Trimmed Mean ( 15 / 30 )-6.781055415750.00456932290057117-1484.03944376581
Trimmed Mean ( 16 / 30 )-6.780966931862070.00440495733194782-1539.39446420554
Trimmed Mean ( 17 / 30 )-6.780912391285710.00426760548863780-1588.92671999308
Trimmed Mean ( 18 / 30 )-6.781056912981480.00416946230902439-1626.36244445826
Trimmed Mean ( 19 / 30 )-6.781143488038460.00406784884059784-1667.00970310437
Trimmed Mean ( 20 / 30 )-6.781207713760.00396762574651880-1709.13492022523
Trimmed Mean ( 21 / 30 )-6.7810876788750.00391449832472816-1732.30056991937
Trimmed Mean ( 22 / 30 )-6.78104953178260.00386972773460955-1752.33246285912
Trimmed Mean ( 23 / 30 )-6.781037892363640.00381728314789826-1776.40421986961
Trimmed Mean ( 24 / 30 )-6.781023789047620.00375821390994627-1804.32086931012
Trimmed Mean ( 25 / 30 )-6.7809857558750.00369426852902366-1835.54219261563
Trimmed Mean ( 26 / 30 )-6.7809857558750.00362713315807026-1869.51662934886
Trimmed Mean ( 27 / 30 )-6.780985827416670.00356275695158726-1903.29733954926
Trimmed Mean ( 28 / 30 )-6.780929718588240.00349737221338724-1938.86418283767
Trimmed Mean ( 29 / 30 )-6.780889764843750.00340675029893578-1990.42758342518
Trimmed Mean ( 30 / 30 )-6.780891342666670.00331705850556378-2044.24833969401
Median-6.780973853
Midrange-6.812241008
Midmean - Weighted Average at Xnp-6.78196386835555
Midmean - Weighted Average at X(n+1)p-6.7810495317826
Midmean - Empirical Distribution Function-6.7810495317826
Midmean - Empirical Distribution Function - Averaging-6.7810495317826
Midmean - Empirical Distribution Function - Interpolation-6.78103789236364
Midmean - Closest Observation-6.7810495317826
Midmean - True Basic - Statistics Graphics Toolkit-6.7810495317826
Midmean - MS Excel (old versions)-6.7810495317826
Number of observations90

\begin{tabular}{lllllllll}
\hline
Central Tendency - Ungrouped Data \tabularnewline
Measure & Value & S.E. & Value/S.E. \tabularnewline
Arithmetic Mean & -6.78337108142222 & 0.00769456182049757 & -881.579905349773 \tabularnewline
Geometric Mean & NaN &  &  \tabularnewline
Harmonic Mean & -6.78259699227838 &  &  \tabularnewline
Quadratic Mean & 6.78375947298683 &  &  \tabularnewline
Winsorized Mean ( 1 / 30 ) & -6.78338080304445 & 0.00769054311005296 & -882.04184099525 \tabularnewline
Winsorized Mean ( 2 / 30 ) & -6.78308238053333 & 0.0076002673988128 & -892.479438498819 \tabularnewline
Winsorized Mean ( 3 / 30 ) & -6.7823525824 & 0.00737227130316142 & -919.981414613914 \tabularnewline
Winsorized Mean ( 4 / 30 ) & -6.78204134684445 & 0.00724966594169879 & -935.497083780833 \tabularnewline
Winsorized Mean ( 5 / 30 ) & -6.7816990384 & 0.00715159667645488 & -948.27761480556 \tabularnewline
Winsorized Mean ( 6 / 30 ) & -6.78160889946667 & 0.0069871250061076 & -970.58645630910 \tabularnewline
Winsorized Mean ( 7 / 30 ) & -6.78141623317778 & 0.00694276731059155 & -976.75983218282 \tabularnewline
Winsorized Mean ( 8 / 30 ) & -6.77968226162222 & 0.006483307612776 & -1045.71349480043 \tabularnewline
Winsorized Mean ( 9 / 30 ) & -6.77969070562222 & 0.00642694095158799 & -1054.88610471006 \tabularnewline
Winsorized Mean ( 10 / 30 ) & -6.77937465262222 & 0.00634717132071714 & -1068.09385001069 \tabularnewline
Winsorized Mean ( 11 / 30 ) & -6.77937302327778 & 0.00601547299657523 & -1126.98918724055 \tabularnewline
Winsorized Mean ( 12 / 30 ) & -6.78010995714444 & 0.00574959978650618 & -1179.23163505341 \tabularnewline
Winsorized Mean ( 13 / 30 ) & -6.7802773437 & 0.00568977966601447 & -1191.65903456669 \tabularnewline
Winsorized Mean ( 14 / 30 ) & -6.78026960216667 & 0.00566159221670156 & -1197.59059689340 \tabularnewline
Winsorized Mean ( 15 / 30 ) & -6.78191076 & 0.00524399209336527 & -1293.27249912915 \tabularnewline
Winsorized Mean ( 16 / 30 ) & -6.7815099136 & 0.00490846074562911 & -1381.59603693251 \tabularnewline
Winsorized Mean ( 17 / 30 ) & -6.77943826998889 & 0.00452020673309132 & -1499.80712615604 \tabularnewline
Winsorized Mean ( 18 / 30 ) & -6.78015653238889 & 0.00440382571262142 & -1539.60600960135 \tabularnewline
Winsorized Mean ( 19 / 30 ) & -6.78046554986667 & 0.00425227982362889 & -1594.54829670175 \tabularnewline
Winsorized Mean ( 20 / 30 ) & -6.78248808586667 & 0.00384435219986587 & -1764.27333741776 \tabularnewline
Winsorized Mean ( 21 / 30 ) & -6.78149712433333 & 0.0036982829827661 & -1833.68799952165 \tabularnewline
Winsorized Mean ( 22 / 30 ) & -6.7811747202 & 0.00364494681838690 & -1860.43173140207 \tabularnewline
Winsorized Mean ( 23 / 30 ) & -6.78118926795556 & 0.00357312253732489 & -1897.83283308063 \tabularnewline
Winsorized Mean ( 24 / 30 ) & -6.78142947622222 & 0.00348104378214645 & -1948.10232235594 \tabularnewline
Winsorized Mean ( 25 / 30 ) & -6.78091672455555 & 0.00337261977632449 & -2010.57847438274 \tabularnewline
Winsorized Mean ( 26 / 30 ) & -6.78105956566667 & 0.00323064258580956 & -2098.98166867859 \tabularnewline
Winsorized Mean ( 27 / 30 ) & -6.78155813746667 & 0.00310532083730339 & -2183.85103915886 \tabularnewline
Winsorized Mean ( 28 / 30 ) & -6.78132748031111 & 0.00307236350314065 & -2207.20219901684 \tabularnewline
Winsorized Mean ( 29 / 30 ) & -6.78087451255556 & 0.00290916128989884 & -2330.86922203318 \tabularnewline
Winsorized Mean ( 30 / 30 ) & -6.78119950422222 & 0.00283294273602106 & -2393.69452054177 \tabularnewline
Trimmed Mean ( 1 / 30 ) & -6.78271494672727 & 0.00744207084503349 & -911.401555825521 \tabularnewline
Trimmed Mean ( 2 / 30 ) & -6.78201812034884 & 0.00715489637254439 & -947.884884311336 \tabularnewline
Trimmed Mean ( 3 / 30 ) & -6.78144798096429 & 0.00687882654686936 & -985.843724181505 \tabularnewline
Trimmed Mean ( 4 / 30 ) & -6.78111702921951 & 0.00666126067077302 & -1017.99304431553 \tabularnewline
Trimmed Mean ( 5 / 30 ) & -6.7808570648875 & 0.0064524853240268 & -1050.89073812194 \tabularnewline
Trimmed Mean ( 6 / 30 ) & -6.78066276330769 & 0.00623929016520405 & -1086.76829956119 \tabularnewline
Trimmed Mean ( 7 / 30 ) & -6.78047602590789 & 0.00603473902546282 & -1123.57402653181 \tabularnewline
Trimmed Mean ( 8 / 30 ) & -6.78031266943243 & 0.00580549098534674 & -1167.91373658941 \tabularnewline
Trimmed Mean ( 9 / 30 ) & -6.78041117065278 & 0.0056421552447752 & -1201.74133402863 \tabularnewline
Trimmed Mean ( 10 / 30 ) & -6.78051409422857 & 0.00546111327762911 & -1241.59923984808 \tabularnewline
Trimmed Mean ( 11 / 30 ) & -6.78066490267647 & 0.00526244589387968 & -1288.50064008497 \tabularnewline
Trimmed Mean ( 12 / 30 ) & -6.78082505301515 & 0.00509297348331487 & -1331.40788484956 \tabularnewline
Trimmed Mean ( 13 / 30 ) & -6.78082505301515 & 0.00494207981722341 & -1372.05899212384 \tabularnewline
Trimmed Mean ( 14 / 30 ) & -6.7809793692742 & 0.00477143488578134 & -1421.16146014718 \tabularnewline
Trimmed Mean ( 15 / 30 ) & -6.78105541575 & 0.00456932290057117 & -1484.03944376581 \tabularnewline
Trimmed Mean ( 16 / 30 ) & -6.78096693186207 & 0.00440495733194782 & -1539.39446420554 \tabularnewline
Trimmed Mean ( 17 / 30 ) & -6.78091239128571 & 0.00426760548863780 & -1588.92671999308 \tabularnewline
Trimmed Mean ( 18 / 30 ) & -6.78105691298148 & 0.00416946230902439 & -1626.36244445826 \tabularnewline
Trimmed Mean ( 19 / 30 ) & -6.78114348803846 & 0.00406784884059784 & -1667.00970310437 \tabularnewline
Trimmed Mean ( 20 / 30 ) & -6.78120771376 & 0.00396762574651880 & -1709.13492022523 \tabularnewline
Trimmed Mean ( 21 / 30 ) & -6.781087678875 & 0.00391449832472816 & -1732.30056991937 \tabularnewline
Trimmed Mean ( 22 / 30 ) & -6.7810495317826 & 0.00386972773460955 & -1752.33246285912 \tabularnewline
Trimmed Mean ( 23 / 30 ) & -6.78103789236364 & 0.00381728314789826 & -1776.40421986961 \tabularnewline
Trimmed Mean ( 24 / 30 ) & -6.78102378904762 & 0.00375821390994627 & -1804.32086931012 \tabularnewline
Trimmed Mean ( 25 / 30 ) & -6.780985755875 & 0.00369426852902366 & -1835.54219261563 \tabularnewline
Trimmed Mean ( 26 / 30 ) & -6.780985755875 & 0.00362713315807026 & -1869.51662934886 \tabularnewline
Trimmed Mean ( 27 / 30 ) & -6.78098582741667 & 0.00356275695158726 & -1903.29733954926 \tabularnewline
Trimmed Mean ( 28 / 30 ) & -6.78092971858824 & 0.00349737221338724 & -1938.86418283767 \tabularnewline
Trimmed Mean ( 29 / 30 ) & -6.78088976484375 & 0.00340675029893578 & -1990.42758342518 \tabularnewline
Trimmed Mean ( 30 / 30 ) & -6.78089134266667 & 0.00331705850556378 & -2044.24833969401 \tabularnewline
Median & -6.780973853 &  &  \tabularnewline
Midrange & -6.812241008 &  &  \tabularnewline
Midmean - Weighted Average at Xnp & -6.78196386835555 &  &  \tabularnewline
Midmean - Weighted Average at X(n+1)p & -6.7810495317826 &  &  \tabularnewline
Midmean - Empirical Distribution Function & -6.7810495317826 &  &  \tabularnewline
Midmean - Empirical Distribution Function - Averaging & -6.7810495317826 &  &  \tabularnewline
Midmean - Empirical Distribution Function - Interpolation & -6.78103789236364 &  &  \tabularnewline
Midmean - Closest Observation & -6.7810495317826 &  &  \tabularnewline
Midmean - True Basic - Statistics Graphics Toolkit & -6.7810495317826 &  &  \tabularnewline
Midmean - MS Excel (old versions) & -6.7810495317826 &  &  \tabularnewline
Number of observations & 90 &  &  \tabularnewline
\hline
\end{tabular}
%Source: https://freestatistics.org/blog/index.php?pk=51718&T=1

[TABLE]
[ROW][C]Central Tendency - Ungrouped Data[/C][/ROW]
[ROW][C]Measure[/C][C]Value[/C][C]S.E.[/C][C]Value/S.E.[/C][/ROW]
[ROW][C]Arithmetic Mean[/C][C]-6.78337108142222[/C][C]0.00769456182049757[/C][C]-881.579905349773[/C][/ROW]
[ROW][C]Geometric Mean[/C][C]NaN[/C][C][/C][C][/C][/ROW]
[ROW][C]Harmonic Mean[/C][C]-6.78259699227838[/C][C][/C][C][/C][/ROW]
[ROW][C]Quadratic Mean[/C][C]6.78375947298683[/C][C][/C][C][/C][/ROW]
[ROW][C]Winsorized Mean ( 1 / 30 )[/C][C]-6.78338080304445[/C][C]0.00769054311005296[/C][C]-882.04184099525[/C][/ROW]
[ROW][C]Winsorized Mean ( 2 / 30 )[/C][C]-6.78308238053333[/C][C]0.0076002673988128[/C][C]-892.479438498819[/C][/ROW]
[ROW][C]Winsorized Mean ( 3 / 30 )[/C][C]-6.7823525824[/C][C]0.00737227130316142[/C][C]-919.981414613914[/C][/ROW]
[ROW][C]Winsorized Mean ( 4 / 30 )[/C][C]-6.78204134684445[/C][C]0.00724966594169879[/C][C]-935.497083780833[/C][/ROW]
[ROW][C]Winsorized Mean ( 5 / 30 )[/C][C]-6.7816990384[/C][C]0.00715159667645488[/C][C]-948.27761480556[/C][/ROW]
[ROW][C]Winsorized Mean ( 6 / 30 )[/C][C]-6.78160889946667[/C][C]0.0069871250061076[/C][C]-970.58645630910[/C][/ROW]
[ROW][C]Winsorized Mean ( 7 / 30 )[/C][C]-6.78141623317778[/C][C]0.00694276731059155[/C][C]-976.75983218282[/C][/ROW]
[ROW][C]Winsorized Mean ( 8 / 30 )[/C][C]-6.77968226162222[/C][C]0.006483307612776[/C][C]-1045.71349480043[/C][/ROW]
[ROW][C]Winsorized Mean ( 9 / 30 )[/C][C]-6.77969070562222[/C][C]0.00642694095158799[/C][C]-1054.88610471006[/C][/ROW]
[ROW][C]Winsorized Mean ( 10 / 30 )[/C][C]-6.77937465262222[/C][C]0.00634717132071714[/C][C]-1068.09385001069[/C][/ROW]
[ROW][C]Winsorized Mean ( 11 / 30 )[/C][C]-6.77937302327778[/C][C]0.00601547299657523[/C][C]-1126.98918724055[/C][/ROW]
[ROW][C]Winsorized Mean ( 12 / 30 )[/C][C]-6.78010995714444[/C][C]0.00574959978650618[/C][C]-1179.23163505341[/C][/ROW]
[ROW][C]Winsorized Mean ( 13 / 30 )[/C][C]-6.7802773437[/C][C]0.00568977966601447[/C][C]-1191.65903456669[/C][/ROW]
[ROW][C]Winsorized Mean ( 14 / 30 )[/C][C]-6.78026960216667[/C][C]0.00566159221670156[/C][C]-1197.59059689340[/C][/ROW]
[ROW][C]Winsorized Mean ( 15 / 30 )[/C][C]-6.78191076[/C][C]0.00524399209336527[/C][C]-1293.27249912915[/C][/ROW]
[ROW][C]Winsorized Mean ( 16 / 30 )[/C][C]-6.7815099136[/C][C]0.00490846074562911[/C][C]-1381.59603693251[/C][/ROW]
[ROW][C]Winsorized Mean ( 17 / 30 )[/C][C]-6.77943826998889[/C][C]0.00452020673309132[/C][C]-1499.80712615604[/C][/ROW]
[ROW][C]Winsorized Mean ( 18 / 30 )[/C][C]-6.78015653238889[/C][C]0.00440382571262142[/C][C]-1539.60600960135[/C][/ROW]
[ROW][C]Winsorized Mean ( 19 / 30 )[/C][C]-6.78046554986667[/C][C]0.00425227982362889[/C][C]-1594.54829670175[/C][/ROW]
[ROW][C]Winsorized Mean ( 20 / 30 )[/C][C]-6.78248808586667[/C][C]0.00384435219986587[/C][C]-1764.27333741776[/C][/ROW]
[ROW][C]Winsorized Mean ( 21 / 30 )[/C][C]-6.78149712433333[/C][C]0.0036982829827661[/C][C]-1833.68799952165[/C][/ROW]
[ROW][C]Winsorized Mean ( 22 / 30 )[/C][C]-6.7811747202[/C][C]0.00364494681838690[/C][C]-1860.43173140207[/C][/ROW]
[ROW][C]Winsorized Mean ( 23 / 30 )[/C][C]-6.78118926795556[/C][C]0.00357312253732489[/C][C]-1897.83283308063[/C][/ROW]
[ROW][C]Winsorized Mean ( 24 / 30 )[/C][C]-6.78142947622222[/C][C]0.00348104378214645[/C][C]-1948.10232235594[/C][/ROW]
[ROW][C]Winsorized Mean ( 25 / 30 )[/C][C]-6.78091672455555[/C][C]0.00337261977632449[/C][C]-2010.57847438274[/C][/ROW]
[ROW][C]Winsorized Mean ( 26 / 30 )[/C][C]-6.78105956566667[/C][C]0.00323064258580956[/C][C]-2098.98166867859[/C][/ROW]
[ROW][C]Winsorized Mean ( 27 / 30 )[/C][C]-6.78155813746667[/C][C]0.00310532083730339[/C][C]-2183.85103915886[/C][/ROW]
[ROW][C]Winsorized Mean ( 28 / 30 )[/C][C]-6.78132748031111[/C][C]0.00307236350314065[/C][C]-2207.20219901684[/C][/ROW]
[ROW][C]Winsorized Mean ( 29 / 30 )[/C][C]-6.78087451255556[/C][C]0.00290916128989884[/C][C]-2330.86922203318[/C][/ROW]
[ROW][C]Winsorized Mean ( 30 / 30 )[/C][C]-6.78119950422222[/C][C]0.00283294273602106[/C][C]-2393.69452054177[/C][/ROW]
[ROW][C]Trimmed Mean ( 1 / 30 )[/C][C]-6.78271494672727[/C][C]0.00744207084503349[/C][C]-911.401555825521[/C][/ROW]
[ROW][C]Trimmed Mean ( 2 / 30 )[/C][C]-6.78201812034884[/C][C]0.00715489637254439[/C][C]-947.884884311336[/C][/ROW]
[ROW][C]Trimmed Mean ( 3 / 30 )[/C][C]-6.78144798096429[/C][C]0.00687882654686936[/C][C]-985.843724181505[/C][/ROW]
[ROW][C]Trimmed Mean ( 4 / 30 )[/C][C]-6.78111702921951[/C][C]0.00666126067077302[/C][C]-1017.99304431553[/C][/ROW]
[ROW][C]Trimmed Mean ( 5 / 30 )[/C][C]-6.7808570648875[/C][C]0.0064524853240268[/C][C]-1050.89073812194[/C][/ROW]
[ROW][C]Trimmed Mean ( 6 / 30 )[/C][C]-6.78066276330769[/C][C]0.00623929016520405[/C][C]-1086.76829956119[/C][/ROW]
[ROW][C]Trimmed Mean ( 7 / 30 )[/C][C]-6.78047602590789[/C][C]0.00603473902546282[/C][C]-1123.57402653181[/C][/ROW]
[ROW][C]Trimmed Mean ( 8 / 30 )[/C][C]-6.78031266943243[/C][C]0.00580549098534674[/C][C]-1167.91373658941[/C][/ROW]
[ROW][C]Trimmed Mean ( 9 / 30 )[/C][C]-6.78041117065278[/C][C]0.0056421552447752[/C][C]-1201.74133402863[/C][/ROW]
[ROW][C]Trimmed Mean ( 10 / 30 )[/C][C]-6.78051409422857[/C][C]0.00546111327762911[/C][C]-1241.59923984808[/C][/ROW]
[ROW][C]Trimmed Mean ( 11 / 30 )[/C][C]-6.78066490267647[/C][C]0.00526244589387968[/C][C]-1288.50064008497[/C][/ROW]
[ROW][C]Trimmed Mean ( 12 / 30 )[/C][C]-6.78082505301515[/C][C]0.00509297348331487[/C][C]-1331.40788484956[/C][/ROW]
[ROW][C]Trimmed Mean ( 13 / 30 )[/C][C]-6.78082505301515[/C][C]0.00494207981722341[/C][C]-1372.05899212384[/C][/ROW]
[ROW][C]Trimmed Mean ( 14 / 30 )[/C][C]-6.7809793692742[/C][C]0.00477143488578134[/C][C]-1421.16146014718[/C][/ROW]
[ROW][C]Trimmed Mean ( 15 / 30 )[/C][C]-6.78105541575[/C][C]0.00456932290057117[/C][C]-1484.03944376581[/C][/ROW]
[ROW][C]Trimmed Mean ( 16 / 30 )[/C][C]-6.78096693186207[/C][C]0.00440495733194782[/C][C]-1539.39446420554[/C][/ROW]
[ROW][C]Trimmed Mean ( 17 / 30 )[/C][C]-6.78091239128571[/C][C]0.00426760548863780[/C][C]-1588.92671999308[/C][/ROW]
[ROW][C]Trimmed Mean ( 18 / 30 )[/C][C]-6.78105691298148[/C][C]0.00416946230902439[/C][C]-1626.36244445826[/C][/ROW]
[ROW][C]Trimmed Mean ( 19 / 30 )[/C][C]-6.78114348803846[/C][C]0.00406784884059784[/C][C]-1667.00970310437[/C][/ROW]
[ROW][C]Trimmed Mean ( 20 / 30 )[/C][C]-6.78120771376[/C][C]0.00396762574651880[/C][C]-1709.13492022523[/C][/ROW]
[ROW][C]Trimmed Mean ( 21 / 30 )[/C][C]-6.781087678875[/C][C]0.00391449832472816[/C][C]-1732.30056991937[/C][/ROW]
[ROW][C]Trimmed Mean ( 22 / 30 )[/C][C]-6.7810495317826[/C][C]0.00386972773460955[/C][C]-1752.33246285912[/C][/ROW]
[ROW][C]Trimmed Mean ( 23 / 30 )[/C][C]-6.78103789236364[/C][C]0.00381728314789826[/C][C]-1776.40421986961[/C][/ROW]
[ROW][C]Trimmed Mean ( 24 / 30 )[/C][C]-6.78102378904762[/C][C]0.00375821390994627[/C][C]-1804.32086931012[/C][/ROW]
[ROW][C]Trimmed Mean ( 25 / 30 )[/C][C]-6.780985755875[/C][C]0.00369426852902366[/C][C]-1835.54219261563[/C][/ROW]
[ROW][C]Trimmed Mean ( 26 / 30 )[/C][C]-6.780985755875[/C][C]0.00362713315807026[/C][C]-1869.51662934886[/C][/ROW]
[ROW][C]Trimmed Mean ( 27 / 30 )[/C][C]-6.78098582741667[/C][C]0.00356275695158726[/C][C]-1903.29733954926[/C][/ROW]
[ROW][C]Trimmed Mean ( 28 / 30 )[/C][C]-6.78092971858824[/C][C]0.00349737221338724[/C][C]-1938.86418283767[/C][/ROW]
[ROW][C]Trimmed Mean ( 29 / 30 )[/C][C]-6.78088976484375[/C][C]0.00340675029893578[/C][C]-1990.42758342518[/C][/ROW]
[ROW][C]Trimmed Mean ( 30 / 30 )[/C][C]-6.78089134266667[/C][C]0.00331705850556378[/C][C]-2044.24833969401[/C][/ROW]
[ROW][C]Median[/C][C]-6.780973853[/C][C][/C][C][/C][/ROW]
[ROW][C]Midrange[/C][C]-6.812241008[/C][C][/C][C][/C][/ROW]
[ROW][C]Midmean - Weighted Average at Xnp[/C][C]-6.78196386835555[/C][C][/C][C][/C][/ROW]
[ROW][C]Midmean - Weighted Average at X(n+1)p[/C][C]-6.7810495317826[/C][C][/C][C][/C][/ROW]
[ROW][C]Midmean - Empirical Distribution Function[/C][C]-6.7810495317826[/C][C][/C][C][/C][/ROW]
[ROW][C]Midmean - Empirical Distribution Function - Averaging[/C][C]-6.7810495317826[/C][C][/C][C][/C][/ROW]
[ROW][C]Midmean - Empirical Distribution Function - Interpolation[/C][C]-6.78103789236364[/C][C][/C][C][/C][/ROW]
[ROW][C]Midmean - Closest Observation[/C][C]-6.7810495317826[/C][C][/C][C][/C][/ROW]
[ROW][C]Midmean - True Basic - Statistics Graphics Toolkit[/C][C]-6.7810495317826[/C][C][/C][C][/C][/ROW]
[ROW][C]Midmean - MS Excel (old versions)[/C][C]-6.7810495317826[/C][C][/C][C][/C][/ROW]
[ROW][C]Number of observations[/C][C]90[/C][C][/C][C][/C][/ROW]
[/TABLE]
Source: https://freestatistics.org/blog/index.php?pk=51718&T=1

Globally Unique Identifier (entire table): ba.freestatistics.org/blog/index.php?pk=51718&T=1

As an alternative you can also use a QR Code:  

The GUIDs for individual cells are displayed in the table below:

Central Tendency - Ungrouped Data
MeasureValueS.E.Value/S.E.
Arithmetic Mean-6.783371081422220.00769456182049757-881.579905349773
Geometric MeanNaN
Harmonic Mean-6.78259699227838
Quadratic Mean6.78375947298683
Winsorized Mean ( 1 / 30 )-6.783380803044450.00769054311005296-882.04184099525
Winsorized Mean ( 2 / 30 )-6.783082380533330.0076002673988128-892.479438498819
Winsorized Mean ( 3 / 30 )-6.78235258240.00737227130316142-919.981414613914
Winsorized Mean ( 4 / 30 )-6.782041346844450.00724966594169879-935.497083780833
Winsorized Mean ( 5 / 30 )-6.78169903840.00715159667645488-948.27761480556
Winsorized Mean ( 6 / 30 )-6.781608899466670.0069871250061076-970.58645630910
Winsorized Mean ( 7 / 30 )-6.781416233177780.00694276731059155-976.75983218282
Winsorized Mean ( 8 / 30 )-6.779682261622220.006483307612776-1045.71349480043
Winsorized Mean ( 9 / 30 )-6.779690705622220.00642694095158799-1054.88610471006
Winsorized Mean ( 10 / 30 )-6.779374652622220.00634717132071714-1068.09385001069
Winsorized Mean ( 11 / 30 )-6.779373023277780.00601547299657523-1126.98918724055
Winsorized Mean ( 12 / 30 )-6.780109957144440.00574959978650618-1179.23163505341
Winsorized Mean ( 13 / 30 )-6.78027734370.00568977966601447-1191.65903456669
Winsorized Mean ( 14 / 30 )-6.780269602166670.00566159221670156-1197.59059689340
Winsorized Mean ( 15 / 30 )-6.781910760.00524399209336527-1293.27249912915
Winsorized Mean ( 16 / 30 )-6.78150991360.00490846074562911-1381.59603693251
Winsorized Mean ( 17 / 30 )-6.779438269988890.00452020673309132-1499.80712615604
Winsorized Mean ( 18 / 30 )-6.780156532388890.00440382571262142-1539.60600960135
Winsorized Mean ( 19 / 30 )-6.780465549866670.00425227982362889-1594.54829670175
Winsorized Mean ( 20 / 30 )-6.782488085866670.00384435219986587-1764.27333741776
Winsorized Mean ( 21 / 30 )-6.781497124333330.0036982829827661-1833.68799952165
Winsorized Mean ( 22 / 30 )-6.78117472020.00364494681838690-1860.43173140207
Winsorized Mean ( 23 / 30 )-6.781189267955560.00357312253732489-1897.83283308063
Winsorized Mean ( 24 / 30 )-6.781429476222220.00348104378214645-1948.10232235594
Winsorized Mean ( 25 / 30 )-6.780916724555550.00337261977632449-2010.57847438274
Winsorized Mean ( 26 / 30 )-6.781059565666670.00323064258580956-2098.98166867859
Winsorized Mean ( 27 / 30 )-6.781558137466670.00310532083730339-2183.85103915886
Winsorized Mean ( 28 / 30 )-6.781327480311110.00307236350314065-2207.20219901684
Winsorized Mean ( 29 / 30 )-6.780874512555560.00290916128989884-2330.86922203318
Winsorized Mean ( 30 / 30 )-6.781199504222220.00283294273602106-2393.69452054177
Trimmed Mean ( 1 / 30 )-6.782714946727270.00744207084503349-911.401555825521
Trimmed Mean ( 2 / 30 )-6.782018120348840.00715489637254439-947.884884311336
Trimmed Mean ( 3 / 30 )-6.781447980964290.00687882654686936-985.843724181505
Trimmed Mean ( 4 / 30 )-6.781117029219510.00666126067077302-1017.99304431553
Trimmed Mean ( 5 / 30 )-6.78085706488750.0064524853240268-1050.89073812194
Trimmed Mean ( 6 / 30 )-6.780662763307690.00623929016520405-1086.76829956119
Trimmed Mean ( 7 / 30 )-6.780476025907890.00603473902546282-1123.57402653181
Trimmed Mean ( 8 / 30 )-6.780312669432430.00580549098534674-1167.91373658941
Trimmed Mean ( 9 / 30 )-6.780411170652780.0056421552447752-1201.74133402863
Trimmed Mean ( 10 / 30 )-6.780514094228570.00546111327762911-1241.59923984808
Trimmed Mean ( 11 / 30 )-6.780664902676470.00526244589387968-1288.50064008497
Trimmed Mean ( 12 / 30 )-6.780825053015150.00509297348331487-1331.40788484956
Trimmed Mean ( 13 / 30 )-6.780825053015150.00494207981722341-1372.05899212384
Trimmed Mean ( 14 / 30 )-6.78097936927420.00477143488578134-1421.16146014718
Trimmed Mean ( 15 / 30 )-6.781055415750.00456932290057117-1484.03944376581
Trimmed Mean ( 16 / 30 )-6.780966931862070.00440495733194782-1539.39446420554
Trimmed Mean ( 17 / 30 )-6.780912391285710.00426760548863780-1588.92671999308
Trimmed Mean ( 18 / 30 )-6.781056912981480.00416946230902439-1626.36244445826
Trimmed Mean ( 19 / 30 )-6.781143488038460.00406784884059784-1667.00970310437
Trimmed Mean ( 20 / 30 )-6.781207713760.00396762574651880-1709.13492022523
Trimmed Mean ( 21 / 30 )-6.7810876788750.00391449832472816-1732.30056991937
Trimmed Mean ( 22 / 30 )-6.78104953178260.00386972773460955-1752.33246285912
Trimmed Mean ( 23 / 30 )-6.781037892363640.00381728314789826-1776.40421986961
Trimmed Mean ( 24 / 30 )-6.781023789047620.00375821390994627-1804.32086931012
Trimmed Mean ( 25 / 30 )-6.7809857558750.00369426852902366-1835.54219261563
Trimmed Mean ( 26 / 30 )-6.7809857558750.00362713315807026-1869.51662934886
Trimmed Mean ( 27 / 30 )-6.780985827416670.00356275695158726-1903.29733954926
Trimmed Mean ( 28 / 30 )-6.780929718588240.00349737221338724-1938.86418283767
Trimmed Mean ( 29 / 30 )-6.780889764843750.00340675029893578-1990.42758342518
Trimmed Mean ( 30 / 30 )-6.780891342666670.00331705850556378-2044.24833969401
Median-6.780973853
Midrange-6.812241008
Midmean - Weighted Average at Xnp-6.78196386835555
Midmean - Weighted Average at X(n+1)p-6.7810495317826
Midmean - Empirical Distribution Function-6.7810495317826
Midmean - Empirical Distribution Function - Averaging-6.7810495317826
Midmean - Empirical Distribution Function - Interpolation-6.78103789236364
Midmean - Closest Observation-6.7810495317826
Midmean - True Basic - Statistics Graphics Toolkit-6.7810495317826
Midmean - MS Excel (old versions)-6.7810495317826
Number of observations90


Variability - Ungrouped Data
Absolute range0.31149439
Relative range (unbiased)4.26722046792730
Relative range (biased)4.29112665199853
Variance (unbiased)0.0053285653448513
Variance (biased)0.00526935906324184
Standard Deviation (unbiased)0.072997022849232
Standard Deviation (biased)0.0725903510340172
Coefficient of Variation (unbiased)-0.0107611719855856
Coefficient of Variation (biased)-0.0107012207002536
Mean Squared Error (MSE versus 0)46.0193925873385
Mean Squared Error (MSE versus Mean)0.00526935906324184
Mean Absolute Deviation from Mean (MAD Mean)0.0573800497555556
Mean Absolute Deviation from Median (MAD Median)0.0573800497555556
Median Absolute Deviation from Mean0.0415879880000003
Median Absolute Deviation from Median0.0411635545000006
Mean Squared Deviation from Mean0.00526935906324184
Mean Squared Deviation from Median0.00527510576735015
Interquartile Difference (Weighted Average at Xnp)0.0829892010000002
Interquartile Difference (Weighted Average at X(n+1)p)0.0832262449999996
Interquartile Difference (Empirical Distribution Function)0.0828024259999998
Interquartile Difference (Empirical Distribution Function - Averaging)0.0828024259999998
Interquartile Difference (Empirical Distribution Function - Interpolation)0.0822498820000002
Interquartile Difference (Closest Observation)0.0828024259999998
Interquartile Difference (True Basic - Statistics Graphics Toolkit)0.0840738830000003
Interquartile Difference (MS Excel (old versions))0.0828024259999998
Semi Interquartile Difference (Weighted Average at Xnp)0.0414946005000001
Semi Interquartile Difference (Weighted Average at X(n+1)p)0.0416131224999998
Semi Interquartile Difference (Empirical Distribution Function)0.0414012129999999
Semi Interquartile Difference (Empirical Distribution Function - Averaging)0.0414012129999999
Semi Interquartile Difference (Empirical Distribution Function - Interpolation)0.0411249410000001
Semi Interquartile Difference (Closest Observation)0.0414012129999999
Semi Interquartile Difference (True Basic - Statistics Graphics Toolkit)0.0420369415000001
Semi Interquartile Difference (MS Excel (old versions))0.0414012129999999
Coefficient of Quartile Variation (Weighted Average at Xnp)-0.00611837363327581
Coefficient of Quartile Variation (Weighted Average at X(n+1)p)-0.00613629783043432
Coefficient of Quartile Variation (Empirical Distribution Function)-0.00610519794390406
Coefficient of Quartile Variation (Empirical Distribution Function - Averaging)-0.00610519794390406
Coefficient of Quartile Variation (Empirical Distribution Function - Interpolation)-0.0060644513429604
Coefficient of Quartile Variation (Closest Observation)-0.00610519794390406
Coefficient of Quartile Variation (True Basic - Statistics Graphics Toolkit)-0.0061984930672603
Coefficient of Quartile Variation (MS Excel (old versions))-0.00610519794390406
Number of all Pairs of Observations4005
Squared Differences between all Pairs of Observations0.0106571306897026
Mean Absolute Differences between all Pairs of Observations0.0825173289028716
Gini Mean Difference0.0825173289028715
Leik Measure of Dispersion0.505697257274638
Index of Diversity0.988887616487506
Index of Qualitative Variation0.999998713301972
Coefficient of Dispersion-0.00846191874492626
Observations90

\begin{tabular}{lllllllll}
\hline
Variability - Ungrouped Data \tabularnewline
Absolute range & 0.31149439 \tabularnewline
Relative range (unbiased) & 4.26722046792730 \tabularnewline
Relative range (biased) & 4.29112665199853 \tabularnewline
Variance (unbiased) & 0.0053285653448513 \tabularnewline
Variance (biased) & 0.00526935906324184 \tabularnewline
Standard Deviation (unbiased) & 0.072997022849232 \tabularnewline
Standard Deviation (biased) & 0.0725903510340172 \tabularnewline
Coefficient of Variation (unbiased) & -0.0107611719855856 \tabularnewline
Coefficient of Variation (biased) & -0.0107012207002536 \tabularnewline
Mean Squared Error (MSE versus 0) & 46.0193925873385 \tabularnewline
Mean Squared Error (MSE versus Mean) & 0.00526935906324184 \tabularnewline
Mean Absolute Deviation from Mean (MAD Mean) & 0.0573800497555556 \tabularnewline
Mean Absolute Deviation from Median (MAD Median) & 0.0573800497555556 \tabularnewline
Median Absolute Deviation from Mean & 0.0415879880000003 \tabularnewline
Median Absolute Deviation from Median & 0.0411635545000006 \tabularnewline
Mean Squared Deviation from Mean & 0.00526935906324184 \tabularnewline
Mean Squared Deviation from Median & 0.00527510576735015 \tabularnewline
Interquartile Difference (Weighted Average at Xnp) & 0.0829892010000002 \tabularnewline
Interquartile Difference (Weighted Average at X(n+1)p) & 0.0832262449999996 \tabularnewline
Interquartile Difference (Empirical Distribution Function) & 0.0828024259999998 \tabularnewline
Interquartile Difference (Empirical Distribution Function - Averaging) & 0.0828024259999998 \tabularnewline
Interquartile Difference (Empirical Distribution Function - Interpolation) & 0.0822498820000002 \tabularnewline
Interquartile Difference (Closest Observation) & 0.0828024259999998 \tabularnewline
Interquartile Difference (True Basic - Statistics Graphics Toolkit) & 0.0840738830000003 \tabularnewline
Interquartile Difference (MS Excel (old versions)) & 0.0828024259999998 \tabularnewline
Semi Interquartile Difference (Weighted Average at Xnp) & 0.0414946005000001 \tabularnewline
Semi Interquartile Difference (Weighted Average at X(n+1)p) & 0.0416131224999998 \tabularnewline
Semi Interquartile Difference (Empirical Distribution Function) & 0.0414012129999999 \tabularnewline
Semi Interquartile Difference (Empirical Distribution Function - Averaging) & 0.0414012129999999 \tabularnewline
Semi Interquartile Difference (Empirical Distribution Function - Interpolation) & 0.0411249410000001 \tabularnewline
Semi Interquartile Difference (Closest Observation) & 0.0414012129999999 \tabularnewline
Semi Interquartile Difference (True Basic - Statistics Graphics Toolkit) & 0.0420369415000001 \tabularnewline
Semi Interquartile Difference (MS Excel (old versions)) & 0.0414012129999999 \tabularnewline
Coefficient of Quartile Variation (Weighted Average at Xnp) & -0.00611837363327581 \tabularnewline
Coefficient of Quartile Variation (Weighted Average at X(n+1)p) & -0.00613629783043432 \tabularnewline
Coefficient of Quartile Variation (Empirical Distribution Function) & -0.00610519794390406 \tabularnewline
Coefficient of Quartile Variation (Empirical Distribution Function - Averaging) & -0.00610519794390406 \tabularnewline
Coefficient of Quartile Variation (Empirical Distribution Function - Interpolation) & -0.0060644513429604 \tabularnewline
Coefficient of Quartile Variation (Closest Observation) & -0.00610519794390406 \tabularnewline
Coefficient of Quartile Variation (True Basic - Statistics Graphics Toolkit) & -0.0061984930672603 \tabularnewline
Coefficient of Quartile Variation (MS Excel (old versions)) & -0.00610519794390406 \tabularnewline
Number of all Pairs of Observations & 4005 \tabularnewline
Squared Differences between all Pairs of Observations & 0.0106571306897026 \tabularnewline
Mean Absolute Differences between all Pairs of Observations & 0.0825173289028716 \tabularnewline
Gini Mean Difference & 0.0825173289028715 \tabularnewline
Leik Measure of Dispersion & 0.505697257274638 \tabularnewline
Index of Diversity & 0.988887616487506 \tabularnewline
Index of Qualitative Variation & 0.999998713301972 \tabularnewline
Coefficient of Dispersion & -0.00846191874492626 \tabularnewline
Observations & 90 \tabularnewline
\hline
\end{tabular}
%Source: https://freestatistics.org/blog/index.php?pk=51718&T=2

[TABLE]
[ROW][C]Variability - Ungrouped Data[/C][/ROW]
[ROW][C]Absolute range[/C][C]0.31149439[/C][/ROW]
[ROW][C]Relative range (unbiased)[/C][C]4.26722046792730[/C][/ROW]
[ROW][C]Relative range (biased)[/C][C]4.29112665199853[/C][/ROW]
[ROW][C]Variance (unbiased)[/C][C]0.0053285653448513[/C][/ROW]
[ROW][C]Variance (biased)[/C][C]0.00526935906324184[/C][/ROW]
[ROW][C]Standard Deviation (unbiased)[/C][C]0.072997022849232[/C][/ROW]
[ROW][C]Standard Deviation (biased)[/C][C]0.0725903510340172[/C][/ROW]
[ROW][C]Coefficient of Variation (unbiased)[/C][C]-0.0107611719855856[/C][/ROW]
[ROW][C]Coefficient of Variation (biased)[/C][C]-0.0107012207002536[/C][/ROW]
[ROW][C]Mean Squared Error (MSE versus 0)[/C][C]46.0193925873385[/C][/ROW]
[ROW][C]Mean Squared Error (MSE versus Mean)[/C][C]0.00526935906324184[/C][/ROW]
[ROW][C]Mean Absolute Deviation from Mean (MAD Mean)[/C][C]0.0573800497555556[/C][/ROW]
[ROW][C]Mean Absolute Deviation from Median (MAD Median)[/C][C]0.0573800497555556[/C][/ROW]
[ROW][C]Median Absolute Deviation from Mean[/C][C]0.0415879880000003[/C][/ROW]
[ROW][C]Median Absolute Deviation from Median[/C][C]0.0411635545000006[/C][/ROW]
[ROW][C]Mean Squared Deviation from Mean[/C][C]0.00526935906324184[/C][/ROW]
[ROW][C]Mean Squared Deviation from Median[/C][C]0.00527510576735015[/C][/ROW]
[ROW][C]Interquartile Difference (Weighted Average at Xnp)[/C][C]0.0829892010000002[/C][/ROW]
[ROW][C]Interquartile Difference (Weighted Average at X(n+1)p)[/C][C]0.0832262449999996[/C][/ROW]
[ROW][C]Interquartile Difference (Empirical Distribution Function)[/C][C]0.0828024259999998[/C][/ROW]
[ROW][C]Interquartile Difference (Empirical Distribution Function - Averaging)[/C][C]0.0828024259999998[/C][/ROW]
[ROW][C]Interquartile Difference (Empirical Distribution Function - Interpolation)[/C][C]0.0822498820000002[/C][/ROW]
[ROW][C]Interquartile Difference (Closest Observation)[/C][C]0.0828024259999998[/C][/ROW]
[ROW][C]Interquartile Difference (True Basic - Statistics Graphics Toolkit)[/C][C]0.0840738830000003[/C][/ROW]
[ROW][C]Interquartile Difference (MS Excel (old versions))[/C][C]0.0828024259999998[/C][/ROW]
[ROW][C]Semi Interquartile Difference (Weighted Average at Xnp)[/C][C]0.0414946005000001[/C][/ROW]
[ROW][C]Semi Interquartile Difference (Weighted Average at X(n+1)p)[/C][C]0.0416131224999998[/C][/ROW]
[ROW][C]Semi Interquartile Difference (Empirical Distribution Function)[/C][C]0.0414012129999999[/C][/ROW]
[ROW][C]Semi Interquartile Difference (Empirical Distribution Function - Averaging)[/C][C]0.0414012129999999[/C][/ROW]
[ROW][C]Semi Interquartile Difference (Empirical Distribution Function - Interpolation)[/C][C]0.0411249410000001[/C][/ROW]
[ROW][C]Semi Interquartile Difference (Closest Observation)[/C][C]0.0414012129999999[/C][/ROW]
[ROW][C]Semi Interquartile Difference (True Basic - Statistics Graphics Toolkit)[/C][C]0.0420369415000001[/C][/ROW]
[ROW][C]Semi Interquartile Difference (MS Excel (old versions))[/C][C]0.0414012129999999[/C][/ROW]
[ROW][C]Coefficient of Quartile Variation (Weighted Average at Xnp)[/C][C]-0.00611837363327581[/C][/ROW]
[ROW][C]Coefficient of Quartile Variation (Weighted Average at X(n+1)p)[/C][C]-0.00613629783043432[/C][/ROW]
[ROW][C]Coefficient of Quartile Variation (Empirical Distribution Function)[/C][C]-0.00610519794390406[/C][/ROW]
[ROW][C]Coefficient of Quartile Variation (Empirical Distribution Function - Averaging)[/C][C]-0.00610519794390406[/C][/ROW]
[ROW][C]Coefficient of Quartile Variation (Empirical Distribution Function - Interpolation)[/C][C]-0.0060644513429604[/C][/ROW]
[ROW][C]Coefficient of Quartile Variation (Closest Observation)[/C][C]-0.00610519794390406[/C][/ROW]
[ROW][C]Coefficient of Quartile Variation (True Basic - Statistics Graphics Toolkit)[/C][C]-0.0061984930672603[/C][/ROW]
[ROW][C]Coefficient of Quartile Variation (MS Excel (old versions))[/C][C]-0.00610519794390406[/C][/ROW]
[ROW][C]Number of all Pairs of Observations[/C][C]4005[/C][/ROW]
[ROW][C]Squared Differences between all Pairs of Observations[/C][C]0.0106571306897026[/C][/ROW]
[ROW][C]Mean Absolute Differences between all Pairs of Observations[/C][C]0.0825173289028716[/C][/ROW]
[ROW][C]Gini Mean Difference[/C][C]0.0825173289028715[/C][/ROW]
[ROW][C]Leik Measure of Dispersion[/C][C]0.505697257274638[/C][/ROW]
[ROW][C]Index of Diversity[/C][C]0.988887616487506[/C][/ROW]
[ROW][C]Index of Qualitative Variation[/C][C]0.999998713301972[/C][/ROW]
[ROW][C]Coefficient of Dispersion[/C][C]-0.00846191874492626[/C][/ROW]
[ROW][C]Observations[/C][C]90[/C][/ROW]
[/TABLE]
Source: https://freestatistics.org/blog/index.php?pk=51718&T=2

Globally Unique Identifier (entire table): ba.freestatistics.org/blog/index.php?pk=51718&T=2

As an alternative you can also use a QR Code:  

The GUIDs for individual cells are displayed in the table below:

Variability - Ungrouped Data
Absolute range0.31149439
Relative range (unbiased)4.26722046792730
Relative range (biased)4.29112665199853
Variance (unbiased)0.0053285653448513
Variance (biased)0.00526935906324184
Standard Deviation (unbiased)0.072997022849232
Standard Deviation (biased)0.0725903510340172
Coefficient of Variation (unbiased)-0.0107611719855856
Coefficient of Variation (biased)-0.0107012207002536
Mean Squared Error (MSE versus 0)46.0193925873385
Mean Squared Error (MSE versus Mean)0.00526935906324184
Mean Absolute Deviation from Mean (MAD Mean)0.0573800497555556
Mean Absolute Deviation from Median (MAD Median)0.0573800497555556
Median Absolute Deviation from Mean0.0415879880000003
Median Absolute Deviation from Median0.0411635545000006
Mean Squared Deviation from Mean0.00526935906324184
Mean Squared Deviation from Median0.00527510576735015
Interquartile Difference (Weighted Average at Xnp)0.0829892010000002
Interquartile Difference (Weighted Average at X(n+1)p)0.0832262449999996
Interquartile Difference (Empirical Distribution Function)0.0828024259999998
Interquartile Difference (Empirical Distribution Function - Averaging)0.0828024259999998
Interquartile Difference (Empirical Distribution Function - Interpolation)0.0822498820000002
Interquartile Difference (Closest Observation)0.0828024259999998
Interquartile Difference (True Basic - Statistics Graphics Toolkit)0.0840738830000003
Interquartile Difference (MS Excel (old versions))0.0828024259999998
Semi Interquartile Difference (Weighted Average at Xnp)0.0414946005000001
Semi Interquartile Difference (Weighted Average at X(n+1)p)0.0416131224999998
Semi Interquartile Difference (Empirical Distribution Function)0.0414012129999999
Semi Interquartile Difference (Empirical Distribution Function - Averaging)0.0414012129999999
Semi Interquartile Difference (Empirical Distribution Function - Interpolation)0.0411249410000001
Semi Interquartile Difference (Closest Observation)0.0414012129999999
Semi Interquartile Difference (True Basic - Statistics Graphics Toolkit)0.0420369415000001
Semi Interquartile Difference (MS Excel (old versions))0.0414012129999999
Coefficient of Quartile Variation (Weighted Average at Xnp)-0.00611837363327581
Coefficient of Quartile Variation (Weighted Average at X(n+1)p)-0.00613629783043432
Coefficient of Quartile Variation (Empirical Distribution Function)-0.00610519794390406
Coefficient of Quartile Variation (Empirical Distribution Function - Averaging)-0.00610519794390406
Coefficient of Quartile Variation (Empirical Distribution Function - Interpolation)-0.0060644513429604
Coefficient of Quartile Variation (Closest Observation)-0.00610519794390406
Coefficient of Quartile Variation (True Basic - Statistics Graphics Toolkit)-0.0061984930672603
Coefficient of Quartile Variation (MS Excel (old versions))-0.00610519794390406
Number of all Pairs of Observations4005
Squared Differences between all Pairs of Observations0.0106571306897026
Mean Absolute Differences between all Pairs of Observations0.0825173289028716
Gini Mean Difference0.0825173289028715
Leik Measure of Dispersion0.505697257274638
Index of Diversity0.988887616487506
Index of Qualitative Variation0.999998713301972
Coefficient of Dispersion-0.00846191874492626
Observations90


Percentiles - Ungrouped Data
pWeighted Average at XnpWeighted Average at X(n+1)pEmpirical Distribution FunctionEmpirical Distribution Function - AveragingEmpirical Distribution Function - InterpolationClosest ObservationTrue Basic - Statistics Graphics ToolkitMS Excel (old versions)
0.02-6.967635-6.967626-6.967547-6.967547-6.956069-6.967547-6.967909-6.967547
0.04-6.937293-6.936257-6.926934-6.926934-6.921233-6.926934-6.943509-6.926934
0.06-6.913764-6.913316-6.909279-6.909279-6.906817-6.916754-6.912718-6.916754
0.08-6.901492-6.901273-6.899304-6.899304-6.89639-6.902038-6.90007-6.902038
0.1-6.875018-6.874856-6.875018-6.874209-6.873561-6.875018-6.873561-6.875018
0.12-6.870511-6.870078-6.869789-6.869789-6.864161-6.869789-6.873111-6.869789
0.14-6.859458-6.858979-6.858089-6.858089-6.85775-6.858089-6.860622-6.858089
0.16-6.857108-6.857011-6.856742-6.856742-6.855949-6.857352-6.857084-6.856742
0.18-6.851937-6.850586-6.845934-6.845934-6.845679-6.853437-6.848785-6.853437
0.2-6.833173-6.833126-6.833173-6.833054-6.832983-6.833173-6.832983-6.833173
0.22-6.83144-6.831019-6.831066-6.831066-6.829697-6.831066-6.828753-6.831066
0.24-6.826011-6.824933-6.824214-6.824214-6.823671-6.824214-6.827987-6.824214
0.26-6.822276-6.821996-6.82163-6.82163-6.821501-6.822707-6.822341-6.82163
0.28-6.820214-6.819519-6.81823-6.81823-6.818428-6.82071-6.81942-6.82071
0.3-6.816492-6.816228-6.816492-6.816052-6.815876-6.816492-6.815876-6.816492
0.32-6.81497-6.814474-6.81481-6.81481-6.813469-6.81481-6.812351-6.81481
0.34-6.811736-6.811578-6.81155-6.81155-6.811161-6.81155-6.811988-6.81155
0.36-6.809919-6.809795-6.809713-6.809713-6.809673-6.810056-6.809973-6.809713
0.38-6.807238-6.804465-6.8014-6.8014-6.802714-6.808698-6.805633-6.8014
0.4-6.797063-6.79606-6.797063-6.79581-6.795559-6.797063-6.795559-6.797063
0.42-6.794223-6.794125-6.79414-6.79414-6.794115-6.79414-6.794088-6.79414
0.44-6.792856-6.791974-6.792044-6.792044-6.791765-6.792044-6.790366-6.792044
0.46-6.789679-6.78897-6.788755-6.788755-6.788847-6.790296-6.79008-6.788755
0.48-6.785545-6.785325-6.785178-6.785178-6.785307-6.785637-6.78549-6.785178
0.5-6.784391-6.780974-6.784391-6.780974-6.780974-6.784391-6.780974-6.780974
0.52-6.776778-6.776495-6.776583-6.776583-6.776506-6.776583-6.776397-6.776583
0.54-6.772882-6.770322-6.770598-6.770598-6.77048-6.770598-6.768903-6.770598
0.56-6.76829-6.767818-6.767785-6.767785-6.767919-6.768627-6.768593-6.767785
0.58-6.765939-6.765579-6.765443-6.765443-6.765679-6.766063-6.765927-6.765443
0.6-6.765411-6.765157-6.765411-6.7652-6.765242-6.765411-6.765242-6.764988
0.62-6.762908-6.760988-6.762389-6.762389-6.761788-6.762389-6.760455-6.762389
0.64-6.757185-6.754822-6.755938-6.755938-6.756063-6.755938-6.752405-6.755938
0.66-6.751236-6.751071-6.751158-6.751158-6.751192-6.751289-6.749803-6.751158
0.68-6.749439-6.748495-6.748328-6.748328-6.748995-6.749716-6.74955-6.748328
0.7-6.748267-6.746488-6.748267-6.748267-6.747505-6.748267-6.747505-6.745725
0.72-6.74394-6.743164-6.743493-6.743493-6.743442-6.743493-6.743189-6.742859
0.74-6.741767-6.740653-6.741038-6.741038-6.741293-6.741038-6.74029-6.741038
0.76-6.739829-6.739677-6.739716-6.739716-6.739784-6.739904-6.739511-6.739716
0.78-6.737179-6.728239-6.72801-6.72801-6.734657-6.739471-6.739242-6.72801
0.8-6.724677-6.721613-6.724677-6.722762-6.723911-6.724677-6.723911-6.720847
0.82-6.719413-6.7158-6.719054-6.719054-6.71909-6.719054-6.71706-6.713805
0.84-6.705914-6.700407-6.700654-6.700654-6.70381-6.700654-6.70034-6.700654
0.86-6.699335-6.695871-6.698198-6.698198-6.69907-6.700094-6.691574-6.698198
0.88-6.687595-6.680923-6.680984-6.680984-6.686603-6.689247-6.680279-6.680984
0.9-6.680218-6.678685-6.680218-6.679367-6.680048-6.680218-6.680048-6.678515
0.92-6.674692-6.673551-6.673736-6.673736-6.67431-6.673736-6.673664-6.673479
0.94-6.669946-6.666881-6.667591-6.667591-6.669593-6.667591-6.666986-6.666277
0.96-6.665006-6.661658-6.6631-6.6631-6.664879-6.666277-6.660537-6.6631
0.98-6.658839-6.657573-6.65781-6.65781-6.658813-6.659096-6.656731-6.65781

\begin{tabular}{lllllllll}
\hline
Percentiles - Ungrouped Data \tabularnewline
p & Weighted Average at Xnp & Weighted Average at X(n+1)p & Empirical Distribution Function & Empirical Distribution Function - Averaging & Empirical Distribution Function - Interpolation & Closest Observation & True Basic - Statistics Graphics Toolkit & MS Excel (old versions) \tabularnewline
0.02 & -6.967635 & -6.967626 & -6.967547 & -6.967547 & -6.956069 & -6.967547 & -6.967909 & -6.967547 \tabularnewline
0.04 & -6.937293 & -6.936257 & -6.926934 & -6.926934 & -6.921233 & -6.926934 & -6.943509 & -6.926934 \tabularnewline
0.06 & -6.913764 & -6.913316 & -6.909279 & -6.909279 & -6.906817 & -6.916754 & -6.912718 & -6.916754 \tabularnewline
0.08 & -6.901492 & -6.901273 & -6.899304 & -6.899304 & -6.89639 & -6.902038 & -6.90007 & -6.902038 \tabularnewline
0.1 & -6.875018 & -6.874856 & -6.875018 & -6.874209 & -6.873561 & -6.875018 & -6.873561 & -6.875018 \tabularnewline
0.12 & -6.870511 & -6.870078 & -6.869789 & -6.869789 & -6.864161 & -6.869789 & -6.873111 & -6.869789 \tabularnewline
0.14 & -6.859458 & -6.858979 & -6.858089 & -6.858089 & -6.85775 & -6.858089 & -6.860622 & -6.858089 \tabularnewline
0.16 & -6.857108 & -6.857011 & -6.856742 & -6.856742 & -6.855949 & -6.857352 & -6.857084 & -6.856742 \tabularnewline
0.18 & -6.851937 & -6.850586 & -6.845934 & -6.845934 & -6.845679 & -6.853437 & -6.848785 & -6.853437 \tabularnewline
0.2 & -6.833173 & -6.833126 & -6.833173 & -6.833054 & -6.832983 & -6.833173 & -6.832983 & -6.833173 \tabularnewline
0.22 & -6.83144 & -6.831019 & -6.831066 & -6.831066 & -6.829697 & -6.831066 & -6.828753 & -6.831066 \tabularnewline
0.24 & -6.826011 & -6.824933 & -6.824214 & -6.824214 & -6.823671 & -6.824214 & -6.827987 & -6.824214 \tabularnewline
0.26 & -6.822276 & -6.821996 & -6.82163 & -6.82163 & -6.821501 & -6.822707 & -6.822341 & -6.82163 \tabularnewline
0.28 & -6.820214 & -6.819519 & -6.81823 & -6.81823 & -6.818428 & -6.82071 & -6.81942 & -6.82071 \tabularnewline
0.3 & -6.816492 & -6.816228 & -6.816492 & -6.816052 & -6.815876 & -6.816492 & -6.815876 & -6.816492 \tabularnewline
0.32 & -6.81497 & -6.814474 & -6.81481 & -6.81481 & -6.813469 & -6.81481 & -6.812351 & -6.81481 \tabularnewline
0.34 & -6.811736 & -6.811578 & -6.81155 & -6.81155 & -6.811161 & -6.81155 & -6.811988 & -6.81155 \tabularnewline
0.36 & -6.809919 & -6.809795 & -6.809713 & -6.809713 & -6.809673 & -6.810056 & -6.809973 & -6.809713 \tabularnewline
0.38 & -6.807238 & -6.804465 & -6.8014 & -6.8014 & -6.802714 & -6.808698 & -6.805633 & -6.8014 \tabularnewline
0.4 & -6.797063 & -6.79606 & -6.797063 & -6.79581 & -6.795559 & -6.797063 & -6.795559 & -6.797063 \tabularnewline
0.42 & -6.794223 & -6.794125 & -6.79414 & -6.79414 & -6.794115 & -6.79414 & -6.794088 & -6.79414 \tabularnewline
0.44 & -6.792856 & -6.791974 & -6.792044 & -6.792044 & -6.791765 & -6.792044 & -6.790366 & -6.792044 \tabularnewline
0.46 & -6.789679 & -6.78897 & -6.788755 & -6.788755 & -6.788847 & -6.790296 & -6.79008 & -6.788755 \tabularnewline
0.48 & -6.785545 & -6.785325 & -6.785178 & -6.785178 & -6.785307 & -6.785637 & -6.78549 & -6.785178 \tabularnewline
0.5 & -6.784391 & -6.780974 & -6.784391 & -6.780974 & -6.780974 & -6.784391 & -6.780974 & -6.780974 \tabularnewline
0.52 & -6.776778 & -6.776495 & -6.776583 & -6.776583 & -6.776506 & -6.776583 & -6.776397 & -6.776583 \tabularnewline
0.54 & -6.772882 & -6.770322 & -6.770598 & -6.770598 & -6.77048 & -6.770598 & -6.768903 & -6.770598 \tabularnewline
0.56 & -6.76829 & -6.767818 & -6.767785 & -6.767785 & -6.767919 & -6.768627 & -6.768593 & -6.767785 \tabularnewline
0.58 & -6.765939 & -6.765579 & -6.765443 & -6.765443 & -6.765679 & -6.766063 & -6.765927 & -6.765443 \tabularnewline
0.6 & -6.765411 & -6.765157 & -6.765411 & -6.7652 & -6.765242 & -6.765411 & -6.765242 & -6.764988 \tabularnewline
0.62 & -6.762908 & -6.760988 & -6.762389 & -6.762389 & -6.761788 & -6.762389 & -6.760455 & -6.762389 \tabularnewline
0.64 & -6.757185 & -6.754822 & -6.755938 & -6.755938 & -6.756063 & -6.755938 & -6.752405 & -6.755938 \tabularnewline
0.66 & -6.751236 & -6.751071 & -6.751158 & -6.751158 & -6.751192 & -6.751289 & -6.749803 & -6.751158 \tabularnewline
0.68 & -6.749439 & -6.748495 & -6.748328 & -6.748328 & -6.748995 & -6.749716 & -6.74955 & -6.748328 \tabularnewline
0.7 & -6.748267 & -6.746488 & -6.748267 & -6.748267 & -6.747505 & -6.748267 & -6.747505 & -6.745725 \tabularnewline
0.72 & -6.74394 & -6.743164 & -6.743493 & -6.743493 & -6.743442 & -6.743493 & -6.743189 & -6.742859 \tabularnewline
0.74 & -6.741767 & -6.740653 & -6.741038 & -6.741038 & -6.741293 & -6.741038 & -6.74029 & -6.741038 \tabularnewline
0.76 & -6.739829 & -6.739677 & -6.739716 & -6.739716 & -6.739784 & -6.739904 & -6.739511 & -6.739716 \tabularnewline
0.78 & -6.737179 & -6.728239 & -6.72801 & -6.72801 & -6.734657 & -6.739471 & -6.739242 & -6.72801 \tabularnewline
0.8 & -6.724677 & -6.721613 & -6.724677 & -6.722762 & -6.723911 & -6.724677 & -6.723911 & -6.720847 \tabularnewline
0.82 & -6.719413 & -6.7158 & -6.719054 & -6.719054 & -6.71909 & -6.719054 & -6.71706 & -6.713805 \tabularnewline
0.84 & -6.705914 & -6.700407 & -6.700654 & -6.700654 & -6.70381 & -6.700654 & -6.70034 & -6.700654 \tabularnewline
0.86 & -6.699335 & -6.695871 & -6.698198 & -6.698198 & -6.69907 & -6.700094 & -6.691574 & -6.698198 \tabularnewline
0.88 & -6.687595 & -6.680923 & -6.680984 & -6.680984 & -6.686603 & -6.689247 & -6.680279 & -6.680984 \tabularnewline
0.9 & -6.680218 & -6.678685 & -6.680218 & -6.679367 & -6.680048 & -6.680218 & -6.680048 & -6.678515 \tabularnewline
0.92 & -6.674692 & -6.673551 & -6.673736 & -6.673736 & -6.67431 & -6.673736 & -6.673664 & -6.673479 \tabularnewline
0.94 & -6.669946 & -6.666881 & -6.667591 & -6.667591 & -6.669593 & -6.667591 & -6.666986 & -6.666277 \tabularnewline
0.96 & -6.665006 & -6.661658 & -6.6631 & -6.6631 & -6.664879 & -6.666277 & -6.660537 & -6.6631 \tabularnewline
0.98 & -6.658839 & -6.657573 & -6.65781 & -6.65781 & -6.658813 & -6.659096 & -6.656731 & -6.65781 \tabularnewline
\hline
\end{tabular}
%Source: https://freestatistics.org/blog/index.php?pk=51718&T=3

[TABLE]
[ROW][C]Percentiles - Ungrouped Data[/C][/ROW]
[ROW][C]p[/C][C]Weighted Average at Xnp[/C][C]Weighted Average at X(n+1)p[/C][C]Empirical Distribution Function[/C][C]Empirical Distribution Function - Averaging[/C][C]Empirical Distribution Function - Interpolation[/C][C]Closest Observation[/C][C]True Basic - Statistics Graphics Toolkit[/C][C]MS Excel (old versions)[/C][/ROW]
[ROW][C]0.02[/C][C]-6.967635[/C][C]-6.967626[/C][C]-6.967547[/C][C]-6.967547[/C][C]-6.956069[/C][C]-6.967547[/C][C]-6.967909[/C][C]-6.967547[/C][/ROW]
[ROW][C]0.04[/C][C]-6.937293[/C][C]-6.936257[/C][C]-6.926934[/C][C]-6.926934[/C][C]-6.921233[/C][C]-6.926934[/C][C]-6.943509[/C][C]-6.926934[/C][/ROW]
[ROW][C]0.06[/C][C]-6.913764[/C][C]-6.913316[/C][C]-6.909279[/C][C]-6.909279[/C][C]-6.906817[/C][C]-6.916754[/C][C]-6.912718[/C][C]-6.916754[/C][/ROW]
[ROW][C]0.08[/C][C]-6.901492[/C][C]-6.901273[/C][C]-6.899304[/C][C]-6.899304[/C][C]-6.89639[/C][C]-6.902038[/C][C]-6.90007[/C][C]-6.902038[/C][/ROW]
[ROW][C]0.1[/C][C]-6.875018[/C][C]-6.874856[/C][C]-6.875018[/C][C]-6.874209[/C][C]-6.873561[/C][C]-6.875018[/C][C]-6.873561[/C][C]-6.875018[/C][/ROW]
[ROW][C]0.12[/C][C]-6.870511[/C][C]-6.870078[/C][C]-6.869789[/C][C]-6.869789[/C][C]-6.864161[/C][C]-6.869789[/C][C]-6.873111[/C][C]-6.869789[/C][/ROW]
[ROW][C]0.14[/C][C]-6.859458[/C][C]-6.858979[/C][C]-6.858089[/C][C]-6.858089[/C][C]-6.85775[/C][C]-6.858089[/C][C]-6.860622[/C][C]-6.858089[/C][/ROW]
[ROW][C]0.16[/C][C]-6.857108[/C][C]-6.857011[/C][C]-6.856742[/C][C]-6.856742[/C][C]-6.855949[/C][C]-6.857352[/C][C]-6.857084[/C][C]-6.856742[/C][/ROW]
[ROW][C]0.18[/C][C]-6.851937[/C][C]-6.850586[/C][C]-6.845934[/C][C]-6.845934[/C][C]-6.845679[/C][C]-6.853437[/C][C]-6.848785[/C][C]-6.853437[/C][/ROW]
[ROW][C]0.2[/C][C]-6.833173[/C][C]-6.833126[/C][C]-6.833173[/C][C]-6.833054[/C][C]-6.832983[/C][C]-6.833173[/C][C]-6.832983[/C][C]-6.833173[/C][/ROW]
[ROW][C]0.22[/C][C]-6.83144[/C][C]-6.831019[/C][C]-6.831066[/C][C]-6.831066[/C][C]-6.829697[/C][C]-6.831066[/C][C]-6.828753[/C][C]-6.831066[/C][/ROW]
[ROW][C]0.24[/C][C]-6.826011[/C][C]-6.824933[/C][C]-6.824214[/C][C]-6.824214[/C][C]-6.823671[/C][C]-6.824214[/C][C]-6.827987[/C][C]-6.824214[/C][/ROW]
[ROW][C]0.26[/C][C]-6.822276[/C][C]-6.821996[/C][C]-6.82163[/C][C]-6.82163[/C][C]-6.821501[/C][C]-6.822707[/C][C]-6.822341[/C][C]-6.82163[/C][/ROW]
[ROW][C]0.28[/C][C]-6.820214[/C][C]-6.819519[/C][C]-6.81823[/C][C]-6.81823[/C][C]-6.818428[/C][C]-6.82071[/C][C]-6.81942[/C][C]-6.82071[/C][/ROW]
[ROW][C]0.3[/C][C]-6.816492[/C][C]-6.816228[/C][C]-6.816492[/C][C]-6.816052[/C][C]-6.815876[/C][C]-6.816492[/C][C]-6.815876[/C][C]-6.816492[/C][/ROW]
[ROW][C]0.32[/C][C]-6.81497[/C][C]-6.814474[/C][C]-6.81481[/C][C]-6.81481[/C][C]-6.813469[/C][C]-6.81481[/C][C]-6.812351[/C][C]-6.81481[/C][/ROW]
[ROW][C]0.34[/C][C]-6.811736[/C][C]-6.811578[/C][C]-6.81155[/C][C]-6.81155[/C][C]-6.811161[/C][C]-6.81155[/C][C]-6.811988[/C][C]-6.81155[/C][/ROW]
[ROW][C]0.36[/C][C]-6.809919[/C][C]-6.809795[/C][C]-6.809713[/C][C]-6.809713[/C][C]-6.809673[/C][C]-6.810056[/C][C]-6.809973[/C][C]-6.809713[/C][/ROW]
[ROW][C]0.38[/C][C]-6.807238[/C][C]-6.804465[/C][C]-6.8014[/C][C]-6.8014[/C][C]-6.802714[/C][C]-6.808698[/C][C]-6.805633[/C][C]-6.8014[/C][/ROW]
[ROW][C]0.4[/C][C]-6.797063[/C][C]-6.79606[/C][C]-6.797063[/C][C]-6.79581[/C][C]-6.795559[/C][C]-6.797063[/C][C]-6.795559[/C][C]-6.797063[/C][/ROW]
[ROW][C]0.42[/C][C]-6.794223[/C][C]-6.794125[/C][C]-6.79414[/C][C]-6.79414[/C][C]-6.794115[/C][C]-6.79414[/C][C]-6.794088[/C][C]-6.79414[/C][/ROW]
[ROW][C]0.44[/C][C]-6.792856[/C][C]-6.791974[/C][C]-6.792044[/C][C]-6.792044[/C][C]-6.791765[/C][C]-6.792044[/C][C]-6.790366[/C][C]-6.792044[/C][/ROW]
[ROW][C]0.46[/C][C]-6.789679[/C][C]-6.78897[/C][C]-6.788755[/C][C]-6.788755[/C][C]-6.788847[/C][C]-6.790296[/C][C]-6.79008[/C][C]-6.788755[/C][/ROW]
[ROW][C]0.48[/C][C]-6.785545[/C][C]-6.785325[/C][C]-6.785178[/C][C]-6.785178[/C][C]-6.785307[/C][C]-6.785637[/C][C]-6.78549[/C][C]-6.785178[/C][/ROW]
[ROW][C]0.5[/C][C]-6.784391[/C][C]-6.780974[/C][C]-6.784391[/C][C]-6.780974[/C][C]-6.780974[/C][C]-6.784391[/C][C]-6.780974[/C][C]-6.780974[/C][/ROW]
[ROW][C]0.52[/C][C]-6.776778[/C][C]-6.776495[/C][C]-6.776583[/C][C]-6.776583[/C][C]-6.776506[/C][C]-6.776583[/C][C]-6.776397[/C][C]-6.776583[/C][/ROW]
[ROW][C]0.54[/C][C]-6.772882[/C][C]-6.770322[/C][C]-6.770598[/C][C]-6.770598[/C][C]-6.77048[/C][C]-6.770598[/C][C]-6.768903[/C][C]-6.770598[/C][/ROW]
[ROW][C]0.56[/C][C]-6.76829[/C][C]-6.767818[/C][C]-6.767785[/C][C]-6.767785[/C][C]-6.767919[/C][C]-6.768627[/C][C]-6.768593[/C][C]-6.767785[/C][/ROW]
[ROW][C]0.58[/C][C]-6.765939[/C][C]-6.765579[/C][C]-6.765443[/C][C]-6.765443[/C][C]-6.765679[/C][C]-6.766063[/C][C]-6.765927[/C][C]-6.765443[/C][/ROW]
[ROW][C]0.6[/C][C]-6.765411[/C][C]-6.765157[/C][C]-6.765411[/C][C]-6.7652[/C][C]-6.765242[/C][C]-6.765411[/C][C]-6.765242[/C][C]-6.764988[/C][/ROW]
[ROW][C]0.62[/C][C]-6.762908[/C][C]-6.760988[/C][C]-6.762389[/C][C]-6.762389[/C][C]-6.761788[/C][C]-6.762389[/C][C]-6.760455[/C][C]-6.762389[/C][/ROW]
[ROW][C]0.64[/C][C]-6.757185[/C][C]-6.754822[/C][C]-6.755938[/C][C]-6.755938[/C][C]-6.756063[/C][C]-6.755938[/C][C]-6.752405[/C][C]-6.755938[/C][/ROW]
[ROW][C]0.66[/C][C]-6.751236[/C][C]-6.751071[/C][C]-6.751158[/C][C]-6.751158[/C][C]-6.751192[/C][C]-6.751289[/C][C]-6.749803[/C][C]-6.751158[/C][/ROW]
[ROW][C]0.68[/C][C]-6.749439[/C][C]-6.748495[/C][C]-6.748328[/C][C]-6.748328[/C][C]-6.748995[/C][C]-6.749716[/C][C]-6.74955[/C][C]-6.748328[/C][/ROW]
[ROW][C]0.7[/C][C]-6.748267[/C][C]-6.746488[/C][C]-6.748267[/C][C]-6.748267[/C][C]-6.747505[/C][C]-6.748267[/C][C]-6.747505[/C][C]-6.745725[/C][/ROW]
[ROW][C]0.72[/C][C]-6.74394[/C][C]-6.743164[/C][C]-6.743493[/C][C]-6.743493[/C][C]-6.743442[/C][C]-6.743493[/C][C]-6.743189[/C][C]-6.742859[/C][/ROW]
[ROW][C]0.74[/C][C]-6.741767[/C][C]-6.740653[/C][C]-6.741038[/C][C]-6.741038[/C][C]-6.741293[/C][C]-6.741038[/C][C]-6.74029[/C][C]-6.741038[/C][/ROW]
[ROW][C]0.76[/C][C]-6.739829[/C][C]-6.739677[/C][C]-6.739716[/C][C]-6.739716[/C][C]-6.739784[/C][C]-6.739904[/C][C]-6.739511[/C][C]-6.739716[/C][/ROW]
[ROW][C]0.78[/C][C]-6.737179[/C][C]-6.728239[/C][C]-6.72801[/C][C]-6.72801[/C][C]-6.734657[/C][C]-6.739471[/C][C]-6.739242[/C][C]-6.72801[/C][/ROW]
[ROW][C]0.8[/C][C]-6.724677[/C][C]-6.721613[/C][C]-6.724677[/C][C]-6.722762[/C][C]-6.723911[/C][C]-6.724677[/C][C]-6.723911[/C][C]-6.720847[/C][/ROW]
[ROW][C]0.82[/C][C]-6.719413[/C][C]-6.7158[/C][C]-6.719054[/C][C]-6.719054[/C][C]-6.71909[/C][C]-6.719054[/C][C]-6.71706[/C][C]-6.713805[/C][/ROW]
[ROW][C]0.84[/C][C]-6.705914[/C][C]-6.700407[/C][C]-6.700654[/C][C]-6.700654[/C][C]-6.70381[/C][C]-6.700654[/C][C]-6.70034[/C][C]-6.700654[/C][/ROW]
[ROW][C]0.86[/C][C]-6.699335[/C][C]-6.695871[/C][C]-6.698198[/C][C]-6.698198[/C][C]-6.69907[/C][C]-6.700094[/C][C]-6.691574[/C][C]-6.698198[/C][/ROW]
[ROW][C]0.88[/C][C]-6.687595[/C][C]-6.680923[/C][C]-6.680984[/C][C]-6.680984[/C][C]-6.686603[/C][C]-6.689247[/C][C]-6.680279[/C][C]-6.680984[/C][/ROW]
[ROW][C]0.9[/C][C]-6.680218[/C][C]-6.678685[/C][C]-6.680218[/C][C]-6.679367[/C][C]-6.680048[/C][C]-6.680218[/C][C]-6.680048[/C][C]-6.678515[/C][/ROW]
[ROW][C]0.92[/C][C]-6.674692[/C][C]-6.673551[/C][C]-6.673736[/C][C]-6.673736[/C][C]-6.67431[/C][C]-6.673736[/C][C]-6.673664[/C][C]-6.673479[/C][/ROW]
[ROW][C]0.94[/C][C]-6.669946[/C][C]-6.666881[/C][C]-6.667591[/C][C]-6.667591[/C][C]-6.669593[/C][C]-6.667591[/C][C]-6.666986[/C][C]-6.666277[/C][/ROW]
[ROW][C]0.96[/C][C]-6.665006[/C][C]-6.661658[/C][C]-6.6631[/C][C]-6.6631[/C][C]-6.664879[/C][C]-6.666277[/C][C]-6.660537[/C][C]-6.6631[/C][/ROW]
[ROW][C]0.98[/C][C]-6.658839[/C][C]-6.657573[/C][C]-6.65781[/C][C]-6.65781[/C][C]-6.658813[/C][C]-6.659096[/C][C]-6.656731[/C][C]-6.65781[/C][/ROW]
[/TABLE]
Source: https://freestatistics.org/blog/index.php?pk=51718&T=3

Globally Unique Identifier (entire table): ba.freestatistics.org/blog/index.php?pk=51718&T=3

As an alternative you can also use a QR Code:  

The GUIDs for individual cells are displayed in the table below:

Percentiles - Ungrouped Data
pWeighted Average at XnpWeighted Average at X(n+1)pEmpirical Distribution FunctionEmpirical Distribution Function - AveragingEmpirical Distribution Function - InterpolationClosest ObservationTrue Basic - Statistics Graphics ToolkitMS Excel (old versions)
0.02-6.967635-6.967626-6.967547-6.967547-6.956069-6.967547-6.967909-6.967547
0.04-6.937293-6.936257-6.926934-6.926934-6.921233-6.926934-6.943509-6.926934
0.06-6.913764-6.913316-6.909279-6.909279-6.906817-6.916754-6.912718-6.916754
0.08-6.901492-6.901273-6.899304-6.899304-6.89639-6.902038-6.90007-6.902038
0.1-6.875018-6.874856-6.875018-6.874209-6.873561-6.875018-6.873561-6.875018
0.12-6.870511-6.870078-6.869789-6.869789-6.864161-6.869789-6.873111-6.869789
0.14-6.859458-6.858979-6.858089-6.858089-6.85775-6.858089-6.860622-6.858089
0.16-6.857108-6.857011-6.856742-6.856742-6.855949-6.857352-6.857084-6.856742
0.18-6.851937-6.850586-6.845934-6.845934-6.845679-6.853437-6.848785-6.853437
0.2-6.833173-6.833126-6.833173-6.833054-6.832983-6.833173-6.832983-6.833173
0.22-6.83144-6.831019-6.831066-6.831066-6.829697-6.831066-6.828753-6.831066
0.24-6.826011-6.824933-6.824214-6.824214-6.823671-6.824214-6.827987-6.824214
0.26-6.822276-6.821996-6.82163-6.82163-6.821501-6.822707-6.822341-6.82163
0.28-6.820214-6.819519-6.81823-6.81823-6.818428-6.82071-6.81942-6.82071
0.3-6.816492-6.816228-6.816492-6.816052-6.815876-6.816492-6.815876-6.816492
0.32-6.81497-6.814474-6.81481-6.81481-6.813469-6.81481-6.812351-6.81481
0.34-6.811736-6.811578-6.81155-6.81155-6.811161-6.81155-6.811988-6.81155
0.36-6.809919-6.809795-6.809713-6.809713-6.809673-6.810056-6.809973-6.809713
0.38-6.807238-6.804465-6.8014-6.8014-6.802714-6.808698-6.805633-6.8014
0.4-6.797063-6.79606-6.797063-6.79581-6.795559-6.797063-6.795559-6.797063
0.42-6.794223-6.794125-6.79414-6.79414-6.794115-6.79414-6.794088-6.79414
0.44-6.792856-6.791974-6.792044-6.792044-6.791765-6.792044-6.790366-6.792044
0.46-6.789679-6.78897-6.788755-6.788755-6.788847-6.790296-6.79008-6.788755
0.48-6.785545-6.785325-6.785178-6.785178-6.785307-6.785637-6.78549-6.785178
0.5-6.784391-6.780974-6.784391-6.780974-6.780974-6.784391-6.780974-6.780974
0.52-6.776778-6.776495-6.776583-6.776583-6.776506-6.776583-6.776397-6.776583
0.54-6.772882-6.770322-6.770598-6.770598-6.77048-6.770598-6.768903-6.770598
0.56-6.76829-6.767818-6.767785-6.767785-6.767919-6.768627-6.768593-6.767785
0.58-6.765939-6.765579-6.765443-6.765443-6.765679-6.766063-6.765927-6.765443
0.6-6.765411-6.765157-6.765411-6.7652-6.765242-6.765411-6.765242-6.764988
0.62-6.762908-6.760988-6.762389-6.762389-6.761788-6.762389-6.760455-6.762389
0.64-6.757185-6.754822-6.755938-6.755938-6.756063-6.755938-6.752405-6.755938
0.66-6.751236-6.751071-6.751158-6.751158-6.751192-6.751289-6.749803-6.751158
0.68-6.749439-6.748495-6.748328-6.748328-6.748995-6.749716-6.74955-6.748328
0.7-6.748267-6.746488-6.748267-6.748267-6.747505-6.748267-6.747505-6.745725
0.72-6.74394-6.743164-6.743493-6.743493-6.743442-6.743493-6.743189-6.742859
0.74-6.741767-6.740653-6.741038-6.741038-6.741293-6.741038-6.74029-6.741038
0.76-6.739829-6.739677-6.739716-6.739716-6.739784-6.739904-6.739511-6.739716
0.78-6.737179-6.728239-6.72801-6.72801-6.734657-6.739471-6.739242-6.72801
0.8-6.724677-6.721613-6.724677-6.722762-6.723911-6.724677-6.723911-6.720847
0.82-6.719413-6.7158-6.719054-6.719054-6.71909-6.719054-6.71706-6.713805
0.84-6.705914-6.700407-6.700654-6.700654-6.70381-6.700654-6.70034-6.700654
0.86-6.699335-6.695871-6.698198-6.698198-6.69907-6.700094-6.691574-6.698198
0.88-6.687595-6.680923-6.680984-6.680984-6.686603-6.689247-6.680279-6.680984
0.9-6.680218-6.678685-6.680218-6.679367-6.680048-6.680218-6.680048-6.678515
0.92-6.674692-6.673551-6.673736-6.673736-6.67431-6.673736-6.673664-6.673479
0.94-6.669946-6.666881-6.667591-6.667591-6.669593-6.667591-6.666986-6.666277
0.96-6.665006-6.661658-6.6631-6.6631-6.664879-6.666277-6.660537-6.6631
0.98-6.658839-6.657573-6.65781-6.65781-6.658813-6.659096-6.656731-6.65781


Frequency Table (Histogram)
BinsMidpointAbs. FrequencyRel. FrequencyCumul. Rel. Freq.Density
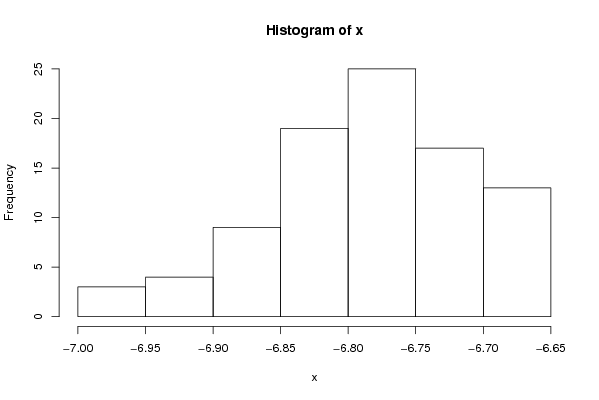
[-7,-6.95[-6.97530.0333330.0333330.666667
[-6.95,-6.9[-6.92540.0444440.0777780.888889
[-6.9,-6.85[-6.87590.10.1777782
[-6.85,-6.8[-6.825190.2111110.3888894.222222
[-6.8,-6.75[-6.775250.2777780.6666675.555556
[-6.75,-6.7[-6.725170.1888890.8555563.777778
[-6.7,-6.65]-6.675130.14444412.888889

\begin{tabular}{lllllllll}
\hline
Frequency Table (Histogram) \tabularnewline
Bins & Midpoint & Abs. Frequency & Rel. Frequency & Cumul. Rel. Freq. & Density \tabularnewline
[-7,-6.95[ & -6.975 & 3 & 0.033333 & 0.033333 & 0.666667 \tabularnewline
[-6.95,-6.9[ & -6.925 & 4 & 0.044444 & 0.077778 & 0.888889 \tabularnewline
[-6.9,-6.85[ & -6.875 & 9 & 0.1 & 0.177778 & 2 \tabularnewline
[-6.85,-6.8[ & -6.825 & 19 & 0.211111 & 0.388889 & 4.222222 \tabularnewline
[-6.8,-6.75[ & -6.775 & 25 & 0.277778 & 0.666667 & 5.555556 \tabularnewline
[-6.75,-6.7[ & -6.725 & 17 & 0.188889 & 0.855556 & 3.777778 \tabularnewline
[-6.7,-6.65] & -6.675 & 13 & 0.144444 & 1 & 2.888889 \tabularnewline
\hline
\end{tabular}
%Source: https://freestatistics.org/blog/index.php?pk=51718&T=4

[TABLE]
[ROW][C]Frequency Table (Histogram)[/C][/ROW]
[ROW][C]Bins[/C][C]Midpoint[/C][C]Abs. Frequency[/C][C]Rel. Frequency[/C][C]Cumul. Rel. Freq.[/C][C]Density[/C][/ROW]
[ROW][C][-7,-6.95[[/C][C]-6.975[/C][C]3[/C][C]0.033333[/C][C]0.033333[/C][C]0.666667[/C][/ROW]
[ROW][C][-6.95,-6.9[[/C][C]-6.925[/C][C]4[/C][C]0.044444[/C][C]0.077778[/C][C]0.888889[/C][/ROW]
[ROW][C][-6.9,-6.85[[/C][C]-6.875[/C][C]9[/C][C]0.1[/C][C]0.177778[/C][C]2[/C][/ROW]
[ROW][C][-6.85,-6.8[[/C][C]-6.825[/C][C]19[/C][C]0.211111[/C][C]0.388889[/C][C]4.222222[/C][/ROW]
[ROW][C][-6.8,-6.75[[/C][C]-6.775[/C][C]25[/C][C]0.277778[/C][C]0.666667[/C][C]5.555556[/C][/ROW]
[ROW][C][-6.75,-6.7[[/C][C]-6.725[/C][C]17[/C][C]0.188889[/C][C]0.855556[/C][C]3.777778[/C][/ROW]
[ROW][C][-6.7,-6.65][/C][C]-6.675[/C][C]13[/C][C]0.144444[/C][C]1[/C][C]2.888889[/C][/ROW]
[/TABLE]
Source: https://freestatistics.org/blog/index.php?pk=51718&T=4

Globally Unique Identifier (entire table): ba.freestatistics.org/blog/index.php?pk=51718&T=4

As an alternative you can also use a QR Code:  

The GUIDs for individual cells are displayed in the table below:

Frequency Table (Histogram)
BinsMidpointAbs. FrequencyRel. FrequencyCumul. Rel. Freq.Density
[-7,-6.95[-6.97530.0333330.0333330.666667
[-6.95,-6.9[-6.92540.0444440.0777780.888889
[-6.9,-6.85[-6.87590.10.1777782
[-6.85,-6.8[-6.825190.2111110.3888894.222222
[-6.8,-6.75[-6.775250.2777780.6666675.555556
[-6.75,-6.7[-6.725170.1888890.8555563.777778
[-6.7,-6.65]-6.675130.14444412.888889


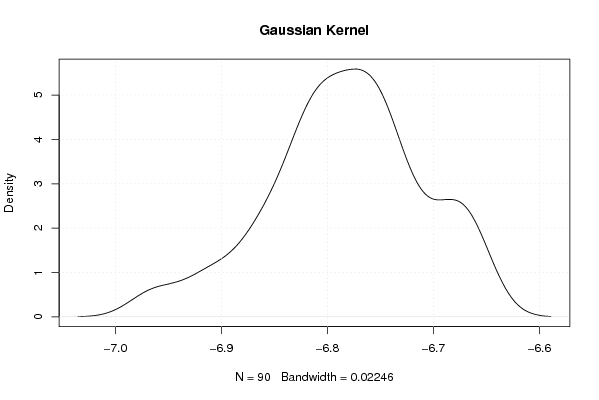
Properties of Density Trace
Bandwidth0.0224607623501904
#Observations90

\begin{tabular}{lllllllll}
\hline
Properties of Density Trace \tabularnewline
Bandwidth & 0.0224607623501904 \tabularnewline
#Observations & 90 \tabularnewline
\hline
\end{tabular}
%Source: https://freestatistics.org/blog/index.php?pk=51718&T=5

[TABLE]
[ROW][C]Properties of Density Trace[/C][/ROW]
[ROW][C]Bandwidth[/C][C]0.0224607623501904[/C][/ROW]
[ROW][C]#Observations[/C][C]90[/C][/ROW]
[/TABLE]
Source: https://freestatistics.org/blog/index.php?pk=51718&T=5

Globally Unique Identifier (entire table): ba.freestatistics.org/blog/index.php?pk=51718&T=5

As an alternative you can also use a QR Code:  

The GUIDs for individual cells are displayed in the table below:

Properties of Density Trace
Bandwidth0.0224607623501904
#Observations90


Parameters (Session):
Parameters (R input):
R code (references can be found in the software module):
load(file='createtable')
x <-sort(x[!is.na(x)])
num <- 50
res <- array(NA,dim=c(num,3))
geomean <- function(x) {
return(exp(mean(log(x))))
}
harmean <- function(x) {
return(1/mean(1/x))
}
quamean <- function(x) {
return(sqrt(mean(x*x)))
}
winmean <- function(x) {
x <-sort(x[!is.na(x)])
n<-length(x)
denom <- 3
nodenom <- n/denom
if (nodenom>40) denom <- n/40
sqrtn = sqrt(n)
roundnodenom = floor(nodenom)
win <- array(NA,dim=c(roundnodenom,2))
for (j in 1:roundnodenom) {
win[j,1] <- (j*x[j+1]+sum(x[(j+1):(n-j)])+j*x[n-j])/n
win[j,2] <- sd(c(rep(x[j+1],j),x[(j+1):(n-j)],rep(x[n-j],j)))/sqrtn
}
return(win)
}
trimean <- function(x) {
x <-sort(x[!is.na(x)])
n<-length(x)
denom <- 3
nodenom <- n/denom
if (nodenom>40) denom <- n/40
sqrtn = sqrt(n)
roundnodenom = floor(nodenom)
tri <- array(NA,dim=c(roundnodenom,2))
for (j in 1:roundnodenom) {
tri[j,1] <- mean(x,trim=j/n)
tri[j,2] <- sd(x[(j+1):(n-j)]) / sqrt(n-j*2)
}
return(tri)
}
midrange <- function(x) {
return((max(x)+min(x))/2)
}
q1 <- function(data,n,p,i,f) {
np <- n*p;
i <<- floor(np)
f <<- np - i
qvalue <- (1-f)*data[i] + f*data[i+1]
}
q2 <- function(data,n,p,i,f) {
np <- (n+1)*p
i <<- floor(np)
f <<- np - i
qvalue <- (1-f)*data[i] + f*data[i+1]
}
q3 <- function(data,n,p,i,f) {
np <- n*p
i <<- floor(np)
f <<- np - i
if (f==0) {
qvalue <- data[i]
} else {
qvalue <- data[i+1]
}
}
q4 <- function(data,n,p,i,f) {
np <- n*p
i <<- floor(np)
f <<- np - i
if (f==0) {
qvalue <- (data[i]+data[i+1])/2
} else {
qvalue <- data[i+1]
}
}
q5 <- function(data,n,p,i,f) {
np <- (n-1)*p
i <<- floor(np)
f <<- np - i
if (f==0) {
qvalue <- data[i+1]
} else {
qvalue <- data[i+1] + f*(data[i+2]-data[i+1])
}
}
q6 <- function(data,n,p,i,f) {
np <- n*p+0.5
i <<- floor(np)
f <<- np - i
qvalue <- data[i]
}
q7 <- function(data,n,p,i,f) {
np <- (n+1)*p
i <<- floor(np)
f <<- np - i
if (f==0) {
qvalue <- data[i]
} else {
qvalue <- f*data[i] + (1-f)*data[i+1]
}
}
q8 <- function(data,n,p,i,f) {
np <- (n+1)*p
i <<- floor(np)
f <<- np - i
if (f==0) {
qvalue <- data[i]
} else {
if (f == 0.5) {
qvalue <- (data[i]+data[i+1])/2
} else {
if (f < 0.5) {
qvalue <- data[i]
} else {
qvalue <- data[i+1]
}
}
}
}
iqd <- function(x,def) {
x <-sort(x[!is.na(x)])
n<-length(x)
if (def==1) {
qvalue1 <- q1(x,n,0.25,i,f)
qvalue3 <- q1(x,n,0.75,i,f)
}
if (def==2) {
qvalue1 <- q2(x,n,0.25,i,f)
qvalue3 <- q2(x,n,0.75,i,f)
}
if (def==3) {
qvalue1 <- q3(x,n,0.25,i,f)
qvalue3 <- q3(x,n,0.75,i,f)
}
if (def==4) {
qvalue1 <- q4(x,n,0.25,i,f)
qvalue3 <- q4(x,n,0.75,i,f)
}
if (def==5) {
qvalue1 <- q5(x,n,0.25,i,f)
qvalue3 <- q5(x,n,0.75,i,f)
}
if (def==6) {
qvalue1 <- q6(x,n,0.25,i,f)
qvalue3 <- q6(x,n,0.75,i,f)
}
if (def==7) {
qvalue1 <- q7(x,n,0.25,i,f)
qvalue3 <- q7(x,n,0.75,i,f)
}
if (def==8) {
qvalue1 <- q8(x,n,0.25,i,f)
qvalue3 <- q8(x,n,0.75,i,f)
}
iqdiff <- qvalue3 - qvalue1
return(c(iqdiff,iqdiff/2,iqdiff/(qvalue3 + qvalue1)))
}
midmean <- function(x,def) {
x <-sort(x[!is.na(x)])
n<-length(x)
if (def==1) {
qvalue1 <- q1(x,n,0.25,i,f)
qvalue3 <- q1(x,n,0.75,i,f)
}
if (def==2) {
qvalue1 <- q2(x,n,0.25,i,f)
qvalue3 <- q2(x,n,0.75,i,f)
}
if (def==3) {
qvalue1 <- q3(x,n,0.25,i,f)
qvalue3 <- q3(x,n,0.75,i,f)
}
if (def==4) {
qvalue1 <- q4(x,n,0.25,i,f)
qvalue3 <- q4(x,n,0.75,i,f)
}
if (def==5) {
qvalue1 <- q5(x,n,0.25,i,f)
qvalue3 <- q5(x,n,0.75,i,f)
}
if (def==6) {
qvalue1 <- q6(x,n,0.25,i,f)
qvalue3 <- q6(x,n,0.75,i,f)
}
if (def==7) {
qvalue1 <- q7(x,n,0.25,i,f)
qvalue3 <- q7(x,n,0.75,i,f)
}
if (def==8) {
qvalue1 <- q8(x,n,0.25,i,f)
qvalue3 <- q8(x,n,0.75,i,f)
}
midm <- 0
myn <- 0
roundno4 <- round(n/4)
round3no4 <- round(3*n/4)
for (i in 1:n) {
if ((x[i]>=qvalue1) & (x[i]<=qvalue3)){
midm = midm + x[i]
myn = myn + 1
}
}
midm = midm / myn
return(midm)
}
range <- max(x) - min(x)
lx <- length(x)
biasf <- (lx-1)/lx
varx <- var(x)
bvarx <- varx*biasf
sdx <- sqrt(varx)
mx <- mean(x)
bsdx <- sqrt(bvarx)
x2 <- x*x
mse0 <- sum(x2)/lx
xmm <- x-mx
xmm2 <- xmm*xmm
msem <- sum(xmm2)/lx
axmm <- abs(x - mx)
medx <- median(x)
axmmed <- abs(x - medx)
xmmed <- x - medx
xmmed2 <- xmmed*xmmed
msemed <- sum(xmmed2)/lx
qarr <- array(NA,dim=c(8,3))
for (j in 1:8) {
qarr[j,] <- iqd(x,j)
}
sdpo <- 0
adpo <- 0
for (i in 1:(lx-1)) {
for (j in (i+1):lx) {
ldi <- x[i]-x[j]
aldi <- abs(ldi)
sdpo = sdpo + ldi * ldi
adpo = adpo + aldi
}
}
denom <- (lx*(lx-1)/2)
sdpo = sdpo / denom
adpo = adpo / denom
gmd <- 0
for (i in 1:lx) {
for (j in 1:lx) {
ldi <- abs(x[i]-x[j])
gmd = gmd + ldi
}
}
gmd <- gmd / (lx*(lx-1))
sumx <- sum(x)
pk <- x / sumx
ck <- cumsum(pk)
dk <- array(NA,dim=lx)
for (i in 1:lx) {
if (ck[i] <= 0.5) dk[i] <- ck[i] else dk[i] <- 1 - ck[i]
}
bigd <- sum(dk) * 2 / (lx-1)
iod <- 1 - sum(pk*pk)
res[1,] <- c('Absolute range','absolute.htm', range)
res[2,] <- c('Relative range (unbiased)','relative.htm', range/sd(x))
res[3,] <- c('Relative range (biased)','relative.htm', range/sqrt(varx*biasf))
res[4,] <- c('Variance (unbiased)','unbiased.htm', varx)
res[5,] <- c('Variance (biased)','biased.htm', bvarx)
res[6,] <- c('Standard Deviation (unbiased)','unbiased1.htm', sdx)
res[7,] <- c('Standard Deviation (biased)','biased1.htm', bsdx)
res[8,] <- c('Coefficient of Variation (unbiased)','variation.htm', sdx/mx)
res[9,] <- c('Coefficient of Variation (biased)','variation.htm', bsdx/mx)
res[10,] <- c('Mean Squared Error (MSE versus 0)','mse.htm', mse0)
res[11,] <- c('Mean Squared Error (MSE versus Mean)','mse.htm', msem)
res[12,] <- c('Mean Absolute Deviation from Mean (MAD Mean)', 'mean2.htm', sum(axmm)/lx)
res[13,] <- c('Mean Absolute Deviation from Median (MAD Median)', 'median1.htm', sum(axmmed)/lx)
res[14,] <- c('Median Absolute Deviation from Mean', 'mean3.htm', median(axmm))
res[15,] <- c('Median Absolute Deviation from Median', 'median2.htm', median(axmmed))
res[16,] <- c('Mean Squared Deviation from Mean', 'mean1.htm', msem)
res[17,] <- c('Mean Squared Deviation from Median', 'median.htm', msemed)
mylink1 <- hyperlink('difference.htm','Interquartile Difference','')
mylink2 <- paste(mylink1,hyperlink('method_1.htm','(Weighted Average at Xnp)',''),sep=' ')
res[18,] <- c('', mylink2, qarr[1,1])
mylink2 <- paste(mylink1,hyperlink('method_2.htm','(Weighted Average at X(n+1)p)',''),sep=' ')
res[19,] <- c('', mylink2, qarr[2,1])
mylink2 <- paste(mylink1,hyperlink('method_3.htm','(Empirical Distribution Function)',''),sep=' ')
res[20,] <- c('', mylink2, qarr[3,1])
mylink2 <- paste(mylink1,hyperlink('method_4.htm','(Empirical Distribution Function - Averaging)',''),sep=' ')
res[21,] <- c('', mylink2, qarr[4,1])
mylink2 <- paste(mylink1,hyperlink('method_5.htm','(Empirical Distribution Function - Interpolation)',''),sep=' ')
res[22,] <- c('', mylink2, qarr[5,1])
mylink2 <- paste(mylink1,hyperlink('method_6.htm','(Closest Observation)',''),sep=' ')
res[23,] <- c('', mylink2, qarr[6,1])
mylink2 <- paste(mylink1,hyperlink('method_7.htm','(True Basic - Statistics Graphics Toolkit)',''),sep=' ')
res[24,] <- c('', mylink2, qarr[7,1])
mylink2 <- paste(mylink1,hyperlink('method_8.htm','(MS Excel (old versions))',''),sep=' ')
res[25,] <- c('', mylink2, qarr[8,1])
mylink1 <- hyperlink('deviation.htm','Semi Interquartile Difference','')
mylink2 <- paste(mylink1,hyperlink('method_1.htm','(Weighted Average at Xnp)',''),sep=' ')
res[26,] <- c('', mylink2, qarr[1,2])
mylink2 <- paste(mylink1,hyperlink('method_2.htm','(Weighted Average at X(n+1)p)',''),sep=' ')
res[27,] <- c('', mylink2, qarr[2,2])
mylink2 <- paste(mylink1,hyperlink('method_3.htm','(Empirical Distribution Function)',''),sep=' ')
res[28,] <- c('', mylink2, qarr[3,2])
mylink2 <- paste(mylink1,hyperlink('method_4.htm','(Empirical Distribution Function - Averaging)',''),sep=' ')
res[29,] <- c('', mylink2, qarr[4,2])
mylink2 <- paste(mylink1,hyperlink('method_5.htm','(Empirical Distribution Function - Interpolation)',''),sep=' ')
res[30,] <- c('', mylink2, qarr[5,2])
mylink2 <- paste(mylink1,hyperlink('method_6.htm','(Closest Observation)',''),sep=' ')
res[31,] <- c('', mylink2, qarr[6,2])
mylink2 <- paste(mylink1,hyperlink('method_7.htm','(True Basic - Statistics Graphics Toolkit)',''),sep=' ')
res[32,] <- c('', mylink2, qarr[7,2])
mylink2 <- paste(mylink1,hyperlink('method_8.htm','(MS Excel (old versions))',''),sep=' ')
res[33,] <- c('', mylink2, qarr[8,2])
mylink1 <- hyperlink('variation1.htm','Coefficient of Quartile Variation','')
mylink2 <- paste(mylink1,hyperlink('method_1.htm','(Weighted Average at Xnp)',''),sep=' ')
res[34,] <- c('', mylink2, qarr[1,3])
mylink2 <- paste(mylink1,hyperlink('method_2.htm','(Weighted Average at X(n+1)p)',''),sep=' ')
res[35,] <- c('', mylink2, qarr[2,3])
mylink2 <- paste(mylink1,hyperlink('method_3.htm','(Empirical Distribution Function)',''),sep=' ')
res[36,] <- c('', mylink2, qarr[3,3])
mylink2 <- paste(mylink1,hyperlink('method_4.htm','(Empirical Distribution Function - Averaging)',''),sep=' ')
res[37,] <- c('', mylink2, qarr[4,3])
mylink2 <- paste(mylink1,hyperlink('method_5.htm','(Empirical Distribution Function - Interpolation)',''),sep=' ')
res[38,] <- c('', mylink2, qarr[5,3])
mylink2 <- paste(mylink1,hyperlink('method_6.htm','(Closest Observation)',''),sep=' ')
res[39,] <- c('', mylink2, qarr[6,3])
mylink2 <- paste(mylink1,hyperlink('method_7.htm','(True Basic - Statistics Graphics Toolkit)',''),sep=' ')
res[40,] <- c('', mylink2, qarr[7,3])
mylink2 <- paste(mylink1,hyperlink('method_8.htm','(MS Excel (old versions))',''),sep=' ')
res[41,] <- c('', mylink2, qarr[8,3])
res[42,] <- c('Number of all Pairs of Observations', 'pair_numbers.htm', lx*(lx-1)/2)
res[43,] <- c('Squared Differences between all Pairs of Observations', 'squared_differences.htm', sdpo)
res[44,] <- c('Mean Absolute Differences between all Pairs of Observations', 'mean_abs_differences.htm', adpo)
res[45,] <- c('Gini Mean Difference', 'gini_mean_difference.htm', gmd)
res[46,] <- c('Leik Measure of Dispersion', 'leiks_d.htm', bigd)
res[47,] <- c('Index of Diversity', 'diversity.htm', iod)
res[48,] <- c('Index of Qualitative Variation', 'qualitative_variation.htm', iod*lx/(lx-1))
res[49,] <- c('Coefficient of Dispersion', 'dispersion.htm', sum(axmm)/lx/medx)
res[50,] <- c('Observations', '', lx)
res
(arm <- mean(x))
sqrtn <- sqrt(length(x))
(armse <- sd(x) / sqrtn)
(armose <- arm / armse)
(geo <- geomean(x))
(har <- harmean(x))
(qua <- quamean(x))
(win <- winmean(x))
(tri <- trimean(x))
(midr <- midrange(x))
midm <- array(NA,dim=8)
for (j in 1:8) midm[j] <- midmean(x,j)
midm
bitmap(file='test1.png')
lb <- win[,1] - 2*win[,2]
ub <- win[,1] + 2*win[,2]
if ((ylimmin == '') | (ylimmax == '')) plot(win[,1],type='b',main='Robustness of Central Tendency', xlab='j', pch=19, ylab='Winsorized Mean(j/n)', ylim=c(min(lb),max(ub))) else plot(win[,1],type='l',main='Robustness of Central Tendency', xlab='j', pch=19, ylab='Winsorized Mean(j/n)', ylim=c(ylimmin,ylimmax))
lines(ub,lty=3)
lines(lb,lty=3)
grid()
dev.off()
bitmap(file='test2.png')
lb <- tri[,1] - 2*tri[,2]
ub <- tri[,1] + 2*tri[,2]
if ((ylimmin == '') | (ylimmax == '')) plot(tri[,1],type='b',main='Robustness of Central Tendency', xlab='j', pch=19, ylab='Trimmed Mean(j/n)', ylim=c(min(lb),max(ub))) else plot(tri[,1],type='l',main='Robustness of Central Tendency', xlab='j', pch=19, ylab='Trimmed Mean(j/n)', ylim=c(ylimmin,ylimmax))
lines(ub,lty=3)
lines(lb,lty=3)
grid()
dev.off()
a<-table.start()
a<-table.row.start(a)
a<-table.element(a,'Central Tendency - Ungrouped Data',4,TRUE)
a<-table.row.end(a)
a<-table.row.start(a)
a<-table.element(a,'Measure',header=TRUE)
a<-table.element(a,'Value',header=TRUE)
a<-table.element(a,'S.E.',header=TRUE)
a<-table.element(a,'Value/S.E.',header=TRUE)
a<-table.row.end(a)
a<-table.row.start(a)
a<-table.element(a,hyperlink('arithmetic_mean.htm', 'Arithmetic Mean', 'click to view the definition of the Arithmetic Mean'),header=TRUE)
a<-table.element(a,arm)
a<-table.element(a,hyperlink('arithmetic_mean_standard_error.htm', armse, 'click to view the definition of the Standard Error of the Arithmetic Mean'))
a<-table.element(a,armose)
a<-table.row.end(a)
a<-table.row.start(a)
a<-table.element(a,hyperlink('geometric_mean.htm', 'Geometric Mean', 'click to view the definition of the Geometric Mean'),header=TRUE)
a<-table.element(a,geo)
a<-table.element(a,'')
a<-table.row.end(a)
a<-table.row.start(a)
a<-table.element(a,hyperlink('harmonic_mean.htm', 'Harmonic Mean', 'click to view the definition of the Harmonic Mean'),header=TRUE)
a<-table.element(a,har)
a<-table.element(a,'')
a<-table.row.end(a)
a<-table.row.start(a)
a<-table.element(a,hyperlink('quadratic_mean.htm', 'Quadratic Mean', 'click to view the definition of the Quadratic Mean'),header=TRUE)
a<-table.element(a,qua)
a<-table.element(a,'')
a<-table.row.end(a)
for (j in 1:length(win[,1])) {
a<-table.row.start(a)
mylabel <- paste('Winsorized Mean (',j)
mylabel <- paste(mylabel,'/')
mylabel <- paste(mylabel,length(win[,1]))
mylabel <- paste(mylabel,')')
a<-table.element(a,hyperlink('winsorized_mean.htm', mylabel, 'click to view the definition of the Winsorized Mean'),header=TRUE)
a<-table.element(a,win[j,1])
a<-table.element(a,win[j,2])
a<-table.element(a,win[j,1]/win[j,2])
a<-table.row.end(a)
}
for (j in 1:length(tri[,1])) {
a<-table.row.start(a)
mylabel <- paste('Trimmed Mean (',j)
mylabel <- paste(mylabel,'/')
mylabel <- paste(mylabel,length(tri[,1]))
mylabel <- paste(mylabel,')')
a<-table.element(a,hyperlink('arithmetic_mean.htm', mylabel, 'click to view the definition of the Trimmed Mean'),header=TRUE)
a<-table.element(a,tri[j,1])
a<-table.element(a,tri[j,2])
a<-table.element(a,tri[j,1]/tri[j,2])
a<-table.row.end(a)
}
a<-table.row.start(a)
a<-table.element(a,hyperlink('median_1.htm', 'Median', 'click to view the definition of the Median'),header=TRUE)
a<-table.element(a,median(x))
a<-table.element(a,'')
a<-table.row.end(a)
a<-table.row.start(a)
a<-table.element(a,hyperlink('midrange.htm', 'Midrange', 'click to view the definition of the Midrange'),header=TRUE)
a<-table.element(a,midr)
a<-table.element(a,'')
a<-table.row.end(a)
a<-table.row.start(a)
mymid <- hyperlink('midmean.htm', 'Midmean', 'click to view the definition of the Midmean')
mylabel <- paste(mymid,hyperlink('method_1.htm','Weighted Average at Xnp',''),sep=' - ')
a<-table.element(a,mylabel,header=TRUE)
a<-table.element(a,midm[1])
a<-table.element(a,'')
a<-table.row.end(a)
a<-table.row.start(a)
mymid <- hyperlink('midmean.htm', 'Midmean', 'click to view the definition of the Midmean')
mylabel <- paste(mymid,hyperlink('method_2.htm','Weighted Average at X(n+1)p',''),sep=' - ')
a<-table.element(a,mylabel,header=TRUE)
a<-table.element(a,midm[2])
a<-table.element(a,'')
a<-table.row.end(a)
a<-table.row.start(a)
mymid <- hyperlink('midmean.htm', 'Midmean', 'click to view the definition of the Midmean')
mylabel <- paste(mymid,hyperlink('method_3.htm','Empirical Distribution Function',''),sep=' - ')
a<-table.element(a,mylabel,header=TRUE)
a<-table.element(a,midm[3])
a<-table.element(a,'')
a<-table.row.end(a)
a<-table.row.start(a)
mymid <- hyperlink('midmean.htm', 'Midmean', 'click to view the definition of the Midmean')
mylabel <- paste(mymid,hyperlink('method_4.htm','Empirical Distribution Function - Averaging',''),sep=' - ')
a<-table.element(a,mylabel,header=TRUE)
a<-table.element(a,midm[4])
a<-table.element(a,'')
a<-table.row.end(a)
a<-table.row.start(a)
mymid <- hyperlink('midmean.htm', 'Midmean', 'click to view the definition of the Midmean')
mylabel <- paste(mymid,hyperlink('method_5.htm','Empirical Distribution Function - Interpolation',''),sep=' - ')
a<-table.element(a,mylabel,header=TRUE)
a<-table.element(a,midm[5])
a<-table.element(a,'')
a<-table.row.end(a)
a<-table.row.start(a)
mymid <- hyperlink('midmean.htm', 'Midmean', 'click to view the definition of the Midmean')
mylabel <- paste(mymid,hyperlink('method_6.htm','Closest Observation',''),sep=' - ')
a<-table.element(a,mylabel,header=TRUE)
a<-table.element(a,midm[6])
a<-table.element(a,'')
a<-table.row.end(a)
a<-table.row.start(a)
mymid <- hyperlink('midmean.htm', 'Midmean', 'click to view the definition of the Midmean')
mylabel <- paste(mymid,hyperlink('method_7.htm','True Basic - Statistics Graphics Toolkit',''),sep=' - ')
a<-table.element(a,mylabel,header=TRUE)
a<-table.element(a,midm[7])
a<-table.element(a,'')
a<-table.row.end(a)
a<-table.row.start(a)
mymid <- hyperlink('midmean.htm', 'Midmean', 'click to view the definition of the Midmean')
mylabel <- paste(mymid,hyperlink('method_8.htm','MS Excel (old versions)',''),sep=' - ')
a<-table.element(a,mylabel,header=TRUE)
a<-table.element(a,midm[8])
a<-table.element(a,'')
a<-table.row.end(a)
a<-table.row.start(a)
a<-table.element(a,'Number of observations',header=TRUE)
a<-table.element(a,length(x))
a<-table.element(a,'')
a<-table.row.end(a)
a<-table.end(a)
table.save(a,file='mytable.tab')
a<-table.start()
a<-table.row.start(a)
a<-table.element(a,'Variability - Ungrouped Data',2,TRUE)
a<-table.row.end(a)
for (i in 1:num) {
a<-table.row.start(a)
if (res[i,1] != '') {
a<-table.element(a,hyperlink(res[i,2],res[i,1],''),header=TRUE)
} else {
a<-table.element(a,res[i,2],header=TRUE)
}
a<-table.element(a,res[i,3])
a<-table.row.end(a)
}
a<-table.end(a)
table.save(a,file='mytable1.tab')
lx <- length(x)
qval <- array(NA,dim=c(99,8))
mystep <- 25
mystart <- 25
if (lx>10){
mystep=10
mystart=10
}
if (lx>20){
mystep=5
mystart=5
}
if (lx>50){
mystep=2
mystart=2
}
if (lx>=100){
mystep=1
mystart=1
}
for (perc in seq(mystart,99,mystep)) {
qval[perc,1] <- q1(x,lx,perc/100,i,f)
qval[perc,2] <- q2(x,lx,perc/100,i,f)
qval[perc,3] <- q3(x,lx,perc/100,i,f)
qval[perc,4] <- q4(x,lx,perc/100,i,f)
qval[perc,5] <- q5(x,lx,perc/100,i,f)
qval[perc,6] <- q6(x,lx,perc/100,i,f)
qval[perc,7] <- q7(x,lx,perc/100,i,f)
qval[perc,8] <- q8(x,lx,perc/100,i,f)
}
bitmap(file='test3.png')
myqqnorm <- qqnorm(x,col=2)
qqline(x)
grid()
dev.off()
a<-table.start()
a<-table.row.start(a)
a<-table.element(a,'Percentiles - Ungrouped Data',9,TRUE)
a<-table.row.end(a)
a<-table.row.start(a)
a<-table.element(a,'p',1,TRUE)
a<-table.element(a,hyperlink('method_1.htm', 'Weighted Average at Xnp',''),1,TRUE)
a<-table.element(a,hyperlink('method_2.htm','Weighted Average at X(n+1)p',''),1,TRUE)
a<-table.element(a,hyperlink('method_3.htm','Empirical Distribution Function',''),1,TRUE)
a<-table.element(a,hyperlink('method_4.htm','Empirical Distribution Function - Averaging',''),1,TRUE)
a<-table.element(a,hyperlink('method_5.htm','Empirical Distribution Function - Interpolation',''),1,TRUE)
a<-table.element(a,hyperlink('method_6.htm','Closest Observation',''),1,TRUE)
a<-table.element(a,hyperlink('method_7.htm','True Basic - Statistics Graphics Toolkit',''),1,TRUE)
a<-table.element(a,hyperlink('method_8.htm','MS Excel (old versions)',''),1,TRUE)
a<-table.row.end(a)
for (perc in seq(mystart,99,mystep)) {
a<-table.row.start(a)
a<-table.element(a,round(perc/100,2),1,TRUE)
for (j in 1:8) {
a<-table.element(a,round(qval[perc,j],6))
}
a<-table.row.end(a)
}
a<-table.end(a)
table.save(a,file='mytable2.tab')
bitmap(file='histogram1.png')
myhist<-hist(x)
dev.off()
myhist
n <- length(x)
a<-table.start()
a<-table.row.start(a)
a<-table.element(a,hyperlink('histogram.htm','Frequency Table (Histogram)',''),6,TRUE)
a<-table.row.end(a)
a<-table.row.start(a)
a<-table.element(a,'Bins',header=TRUE)
a<-table.element(a,'Midpoint',header=TRUE)
a<-table.element(a,'Abs. Frequency',header=TRUE)
a<-table.element(a,'Rel. Frequency',header=TRUE)
a<-table.element(a,'Cumul. Rel. Freq.',header=TRUE)
a<-table.element(a,'Density',header=TRUE)
a<-table.row.end(a)
crf <- 0
mybracket <- '['
mynumrows <- (length(myhist$breaks)-1)
for (i in 1:mynumrows) {
a<-table.row.start(a)
if (i == 1)
dum <- paste('[',myhist$breaks[i],sep='')
else
dum <- paste(mybracket,myhist$breaks[i],sep='')
dum <- paste(dum,myhist$breaks[i+1],sep=',')
if (i==mynumrows)
dum <- paste(dum,']',sep='')
else
dum <- paste(dum,mybracket,sep='')
a<-table.element(a,dum,header=TRUE)
a<-table.element(a,myhist$mids[i])
a<-table.element(a,myhist$counts[i])
rf <- myhist$counts[i]/n
crf <- crf + rf
a<-table.element(a,round(rf,6))
a<-table.element(a,round(crf,6))
a<-table.element(a,round(myhist$density[i],6))
a<-table.row.end(a)
}
a<-table.end(a)
table.save(a,file='mytable5.tab')
bitmap(file='density1.png')
mydensity1<-density(x,kernel='gaussian',na.rm=TRUE)
plot(mydensity1,main='Gaussian Kernel')
grid()
dev.off()
mydensity1
a<-table.start()
a<-table.row.start(a)
a<-table.element(a,'Properties of Density Trace',2,TRUE)
a<-table.row.end(a)
a<-table.row.start(a)
a<-table.element(a,'Bandwidth',header=TRUE)
a<-table.element(a,mydensity1$bw)
a<-table.row.end(a)
a<-table.row.start(a)
a<-table.element(a,'#Observations',header=TRUE)
a<-table.element(a,mydensity1$n)
a<-table.row.end(a)
a<-table.end(a)
table.save(a,file='mytable4.tab')