Free Statistics

of Irreproducible Research!

Author's title

Author*The author of this computation has been verified*
R Software Modulerwasp_edabi.wasp
Title produced by softwareBivariate Explorative Data Analysis
Date of computationWed, 28 Oct 2009 09:27:12 -0600
Cite this page as followsStatistical Computations at FreeStatistics.org, Office for Research Development and Education, URL https://freestatistics.org/blog/index.php?v=date/2009/Oct/28/t1256743681vwps07y22dxyvpy.htm/, Retrieved Sun, 05 May 2024 21:40:41 +0000
Statistical Computations at FreeStatistics.org, Office for Research Development and Education, URL https://freestatistics.org/blog/index.php?pk=51424, Retrieved Sun, 05 May 2024 21:40:41 +0000
QR Codes:

Original text written by user:
IsPrivate?No (this computation is public)
User-defined keywords
Estimated Impact99
Family? (F = Feedback message, R = changed R code, M = changed R Module, P = changed Parameters, D = changed Data)
-     [Bivariate Data Series] [Bivariate dataset] [2008-01-05 23:51:08] [74be16979710d4c4e7c6647856088456]
- RMPD  [Bivariate Explorative Data Analysis] [] [2009-10-28 15:24:41] [4d62210f0915d3a20cbf115865da7cd4]
-    D      [Bivariate Explorative Data Analysis] [] [2009-10-28 15:27:12] [91df150cd527c563f0151b3a845ecd72] [Current]
- RMPD        [Kendall tau Rank Correlation] [] [2009-10-28 15:29:54] [4d62210f0915d3a20cbf115865da7cd4]
Feedback Forum

Post a new message
Dataseries X:
64
65,61
59,29
56,25
57,76
60,84
60,84
60,84
56,25
56,25
50,41
56,25
56,25
57,76
59,29
59,29
62,41
65,61
67,24
67,24
67,24
62,41
53,29
47,61
44,89
44,89
47,61
49
50,41
51,84
50,41
47,61
49
46,24
40,96
44,89
43,56
40,96
39,69
38,44
42,25
46,24
46,24
40,96
37,21
33,64
37,21
51,84
53,29
47,61
37,21
33,64
38,44
50,41
59,29
62,41
59,29
54,76
56,25
64
65,61
Dataseries Y:
30913600
15382084
14130081
17123044
21473956
15968016
18558864
17164449
19616041
27237961
24295041
33120025
31270464
17330569
24621444
27123264
22610025
20169081
32855824
32844361
25401600
37234404
24049216
28826161
31114084
21335161
22382361
25110121
28079401
17189316
21390625
22429696
17799961
26173456
17682025
16982641
26040609
18490000
20958084
14508481
30536676
18037009
14668900
19307236
23290276
19439281
20875761
16859236
22982436
15319396
14386849
19404025
16176484
16810000
22924944
10004569
12852225
15233409
17455684
14922769
17530969


Summary of computational transaction
Raw Inputview raw input (R code)
Raw Outputview raw output of R engine
Computing time3 seconds
R Server'Gwilym Jenkins' @ 72.249.127.135

\begin{tabular}{lllllllll}
\hline
Summary of computational transaction \tabularnewline
Raw Input & view raw input (R code)  \tabularnewline
Raw Output & view raw output of R engine  \tabularnewline
Computing time & 3 seconds \tabularnewline
R Server & 'Gwilym Jenkins' @ 72.249.127.135 \tabularnewline
\hline
\end{tabular}
%Source: https://freestatistics.org/blog/index.php?pk=51424&T=0

[TABLE]
[ROW][C]Summary of computational transaction[/C][/ROW]
[ROW][C]Raw Input[/C][C]view raw input (R code) [/C][/ROW]
[ROW][C]Raw Output[/C][C]view raw output of R engine [/C][/ROW]
[ROW][C]Computing time[/C][C]3 seconds[/C][/ROW]
[ROW][C]R Server[/C][C]'Gwilym Jenkins' @ 72.249.127.135[/C][/ROW]
[/TABLE]
Source: https://freestatistics.org/blog/index.php?pk=51424&T=0

Globally Unique Identifier (entire table): ba.freestatistics.org/blog/index.php?pk=51424&T=0

As an alternative you can also use a QR Code:  

The GUIDs for individual cells are displayed in the table below:

Summary of computational transaction
Raw Inputview raw input (R code)
Raw Outputview raw output of R engine
Computing time3 seconds
R Server'Gwilym Jenkins' @ 72.249.127.135


Model: Y[t] = c + b X[t] + e[t]
c16389911.0409177
b96342.8980672915

\begin{tabular}{lllllllll}
\hline
Model: Y[t] = c + b X[t] + e[t] \tabularnewline
c & 16389911.0409177 \tabularnewline
b & 96342.8980672915 \tabularnewline
\hline
\end{tabular}
%Source: https://freestatistics.org/blog/index.php?pk=51424&T=1

[TABLE]
[ROW][C]Model: Y[t] = c + b X[t] + e[t][/C][/ROW]
[ROW][C]c[/C][C]16389911.0409177[/C][/ROW]
[ROW][C]b[/C][C]96342.8980672915[/C][/ROW]
[/TABLE]
Source: https://freestatistics.org/blog/index.php?pk=51424&T=1

Globally Unique Identifier (entire table): ba.freestatistics.org/blog/index.php?pk=51424&T=1

As an alternative you can also use a QR Code:  

The GUIDs for individual cells are displayed in the table below:

Model: Y[t] = c + b X[t] + e[t]
c16389911.0409177
b96342.8980672915


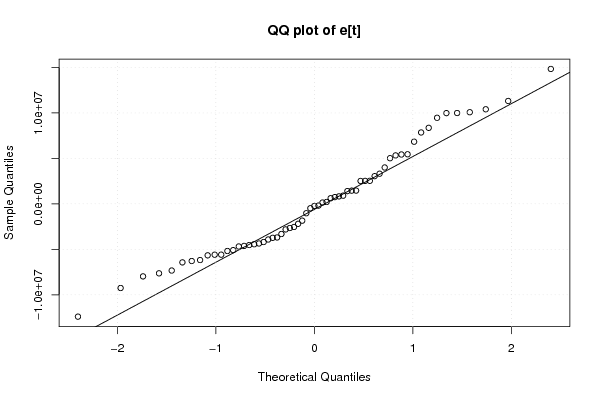
Descriptive Statistics about e[t]
# observations61
minimum-12398102.3092973
Q1-4525090.87672608
median-226861.131901370
mean-4.21662617390823e-10
Q33315445.7219984
maximum14831732.6907027

\begin{tabular}{lllllllll}
\hline
Descriptive Statistics about e[t] \tabularnewline
# observations & 61 \tabularnewline
minimum & -12398102.3092973 \tabularnewline
Q1 & -4525090.87672608 \tabularnewline
median & -226861.131901370 \tabularnewline
mean & -4.21662617390823e-10 \tabularnewline
Q3 & 3315445.7219984 \tabularnewline
maximum & 14831732.6907027 \tabularnewline
\hline
\end{tabular}
%Source: https://freestatistics.org/blog/index.php?pk=51424&T=2

[TABLE]
[ROW][C]Descriptive Statistics about e[t][/C][/ROW]
[ROW][C]# observations[/C][C]61[/C][/ROW]
[ROW][C]minimum[/C][C]-12398102.3092973[/C][/ROW]
[ROW][C]Q1[/C][C]-4525090.87672608[/C][/ROW]
[ROW][C]median[/C][C]-226861.131901370[/C][/ROW]
[ROW][C]mean[/C][C]-4.21662617390823e-10[/C][/ROW]
[ROW][C]Q3[/C][C]3315445.7219984[/C][/ROW]
[ROW][C]maximum[/C][C]14831732.6907027[/C][/ROW]
[/TABLE]
Source: https://freestatistics.org/blog/index.php?pk=51424&T=2

Globally Unique Identifier (entire table): ba.freestatistics.org/blog/index.php?pk=51424&T=2

As an alternative you can also use a QR Code:  

The GUIDs for individual cells are displayed in the table below:

Descriptive Statistics about e[t]
# observations61
minimum-12398102.3092973
Q1-4525090.87672608
median-226861.131901370
mean-4.21662617390823e-10
Q33315445.7219984
maximum14831732.6907027


Parameters (Session):
par1 = 0 ; par2 = 36 ;
Parameters (R input):
par1 = 0 ; par2 = 36 ;
R code (references can be found in the software module):
par1 <- as.numeric(par1)
par2 <- as.numeric(par2)
x <- as.ts(x)
y <- as.ts(y)
mylm <- lm(y~x)
cbind(mylm$resid)
library(lattice)
bitmap(file='pic1.png')
plot(y,type='l',main='Run Sequence Plot of Y[t]',xlab='time or index',ylab='value')
grid()
dev.off()
bitmap(file='pic1a.png')
plot(x,type='l',main='Run Sequence Plot of X[t]',xlab='time or index',ylab='value')
grid()
dev.off()
bitmap(file='pic1b.png')
plot(x,y,main='Scatter Plot',xlab='X[t]',ylab='Y[t]')
grid()
dev.off()
bitmap(file='pic1c.png')
plot(mylm$resid,type='l',main='Run Sequence Plot of e[t]',xlab='time or index',ylab='value')
grid()
dev.off()
bitmap(file='pic2.png')
hist(mylm$resid,main='Histogram of e[t]')
dev.off()
bitmap(file='pic3.png')
if (par1 > 0)
{
densityplot(~mylm$resid,col='black',main=paste('Density Plot of e[t] bw = ',par1),bw=par1)
} else {
densityplot(~mylm$resid,col='black',main='Density Plot of e[t]')
}
dev.off()
bitmap(file='pic4.png')
qqnorm(mylm$resid,main='QQ plot of e[t]')
qqline(mylm$resid)
grid()
dev.off()
if (par2 > 0)
{
bitmap(file='pic5.png')
acf(mylm$resid,lag.max=par2,main='Residual Autocorrelation Function')
grid()
dev.off()
}
summary(x)
load(file='createtable')
a<-table.start()
a<-table.row.start(a)
a<-table.element(a,'Model: Y[t] = c + b X[t] + e[t]',2,TRUE)
a<-table.row.end(a)
a<-table.row.start(a)
a<-table.element(a,'c',1,TRUE)
a<-table.element(a,mylm$coeff[[1]])
a<-table.row.end(a)
a<-table.row.start(a)
a<-table.element(a,'b',1,TRUE)
a<-table.element(a,mylm$coeff[[2]])
a<-table.row.end(a)
a<-table.end(a)
table.save(a,file='mytable.tab')
a<-table.start()
a<-table.row.start(a)
a<-table.element(a,'Descriptive Statistics about e[t]',2,TRUE)
a<-table.row.end(a)
a<-table.row.start(a)
a<-table.element(a,'# observations',header=TRUE)
a<-table.element(a,length(mylm$resid))
a<-table.row.end(a)
a<-table.row.start(a)
a<-table.element(a,'minimum',header=TRUE)
a<-table.element(a,min(mylm$resid))
a<-table.row.end(a)
a<-table.row.start(a)
a<-table.element(a,'Q1',header=TRUE)
a<-table.element(a,quantile(mylm$resid,0.25))
a<-table.row.end(a)
a<-table.row.start(a)
a<-table.element(a,'median',header=TRUE)
a<-table.element(a,median(mylm$resid))
a<-table.row.end(a)
a<-table.row.start(a)
a<-table.element(a,'mean',header=TRUE)
a<-table.element(a,mean(mylm$resid))
a<-table.row.end(a)
a<-table.row.start(a)
a<-table.element(a,'Q3',header=TRUE)
a<-table.element(a,quantile(mylm$resid,0.75))
a<-table.row.end(a)
a<-table.row.start(a)
a<-table.element(a,'maximum',header=TRUE)
a<-table.element(a,max(mylm$resid))
a<-table.row.end(a)
a<-table.end(a)
table.save(a,file='mytable.tab')