Free Statistics

of Irreproducible Research!

Author's title

Author*The author of this computation has been verified*
R Software Modulerwasp_edauni.wasp
Title produced by softwareUnivariate Explorative Data Analysis
Date of computationTue, 27 Oct 2009 19:40:53 -0600
Cite this page as followsStatistical Computations at FreeStatistics.org, Office for Research Development and Education, URL https://freestatistics.org/blog/index.php?v=date/2009/Oct/28/t1256694143uhozzh9q18f9e96.htm/, Retrieved Mon, 06 May 2024 01:51:01 +0000
Statistical Computations at FreeStatistics.org, Office for Research Development and Education, URL https://freestatistics.org/blog/index.php?pk=51331, Retrieved Mon, 06 May 2024 01:51:01 +0000
QR Codes:

Original text written by user:
IsPrivate?No (this computation is public)
User-defined keywordsassumpties
Estimated Impact147
Family? (F = Feedback message, R = changed R code, M = changed R Module, P = changed Parameters, D = changed Data)
-       [Univariate Explorative Data Analysis] [WS3 Yt/Xt assumpties] [2009-10-28 01:40:53] [a54ad7d84632b3d861404e40e79a6400] [Current]
Feedback Forum

Post a new message
Dataseries X:
11.80352941
11.83372093
12.11764706
12.80365854
12.95308642
13.41772152
12.53139535
12.44712644
12.60689655
12.87176471
12.76904762
12.56235294
12.22298851
12.22413793
12.39651163
12.70941176
13.07228916
13.56125
13.30365854
13.48271605
13.2345679
13.26875
13.44936709
13.4835443
13.145
13.21
13.54556962
13.4875
14.04155844
15.05972222
14.536
14.84794521
15.52142857
15.65
15.95571429
15.38333333
15.17534247
15.6
16.52647059
17.634375
18.80983607
17.87846154
15.17662338
14.49493671
15.21466667
16.24927536
16.5
15.45217391
13.75974026
13.37875
13.3875
14.02597403
14.82739726
14.82702703
13.52222222
13.33012048


Summary of computational transaction
Raw Inputview raw input (R code)
Raw Outputview raw output of R engine
Computing time4 seconds
R Server'Sir Ronald Aylmer Fisher' @ 193.190.124.24

\begin{tabular}{lllllllll}
\hline
Summary of computational transaction \tabularnewline
Raw Input & view raw input (R code)  \tabularnewline
Raw Output & view raw output of R engine  \tabularnewline
Computing time & 4 seconds \tabularnewline
R Server & 'Sir Ronald Aylmer Fisher' @ 193.190.124.24 \tabularnewline
\hline
\end{tabular}
%Source: https://freestatistics.org/blog/index.php?pk=51331&T=0

[TABLE]
[ROW][C]Summary of computational transaction[/C][/ROW]
[ROW][C]Raw Input[/C][C]view raw input (R code) [/C][/ROW]
[ROW][C]Raw Output[/C][C]view raw output of R engine [/C][/ROW]
[ROW][C]Computing time[/C][C]4 seconds[/C][/ROW]
[ROW][C]R Server[/C][C]'Sir Ronald Aylmer Fisher' @ 193.190.124.24[/C][/ROW]
[/TABLE]
Source: https://freestatistics.org/blog/index.php?pk=51331&T=0

Globally Unique Identifier (entire table): ba.freestatistics.org/blog/index.php?pk=51331&T=0

As an alternative you can also use a QR Code:  

The GUIDs for individual cells are displayed in the table below:

Summary of computational transaction
Raw Inputview raw input (R code)
Raw Outputview raw output of R engine
Computing time4 seconds
R Server'Sir Ronald Aylmer Fisher' @ 193.190.124.24


Descriptive Statistics
# observations56
minimum11.80352941
Q112.9327559925
median13.48552215
mean14.0586036610714
Q315.1756626975
maximum18.80983607

\begin{tabular}{lllllllll}
\hline
Descriptive Statistics \tabularnewline
# observations & 56 \tabularnewline
minimum & 11.80352941 \tabularnewline
Q1 & 12.9327559925 \tabularnewline
median & 13.48552215 \tabularnewline
mean & 14.0586036610714 \tabularnewline
Q3 & 15.1756626975 \tabularnewline
maximum & 18.80983607 \tabularnewline
\hline
\end{tabular}
%Source: https://freestatistics.org/blog/index.php?pk=51331&T=1

[TABLE]
[ROW][C]Descriptive Statistics[/C][/ROW]
[ROW][C]# observations[/C][C]56[/C][/ROW]
[ROW][C]minimum[/C][C]11.80352941[/C][/ROW]
[ROW][C]Q1[/C][C]12.9327559925[/C][/ROW]
[ROW][C]median[/C][C]13.48552215[/C][/ROW]
[ROW][C]mean[/C][C]14.0586036610714[/C][/ROW]
[ROW][C]Q3[/C][C]15.1756626975[/C][/ROW]
[ROW][C]maximum[/C][C]18.80983607[/C][/ROW]
[/TABLE]
Source: https://freestatistics.org/blog/index.php?pk=51331&T=1

Globally Unique Identifier (entire table): ba.freestatistics.org/blog/index.php?pk=51331&T=1

As an alternative you can also use a QR Code:  

The GUIDs for individual cells are displayed in the table below:

Descriptive Statistics
# observations56
minimum11.80352941
Q112.9327559925
median13.48552215
mean14.0586036610714
Q315.1756626975
maximum18.80983607


Parameters (Session):
par1 = 0 ;
Parameters (R input):
par1 = 0 ; par2 = 36 ;
R code (references can be found in the software module):
par1 <- as.numeric(par1)
par2 <- as.numeric(par2)
x <- as.ts(x)
library(lattice)
bitmap(file='pic1.png')
plot(x,type='l',main='Run Sequence Plot',xlab='time or index',ylab='value')
grid()
dev.off()
bitmap(file='pic2.png')
hist(x)
grid()
dev.off()
bitmap(file='pic3.png')
if (par1 > 0)
{
densityplot(~x,col='black',main=paste('Density Plot bw = ',par1),bw=par1)
} else {
densityplot(~x,col='black',main='Density Plot')
}
dev.off()
bitmap(file='pic4.png')
qqnorm(x)
qqline(x)
grid()
dev.off()
if (par2 > 0)
{
bitmap(file='lagplot1.png')
dum <- cbind(lag(x,k=1),x)
dum
dum1 <- dum[2:length(x),]
dum1
z <- as.data.frame(dum1)
z
plot(z,main='Lag plot (k=1), lowess, and regression line')
lines(lowess(z))
abline(lm(z))
dev.off()
if (par2 > 1) {
bitmap(file='lagplotpar2.png')
dum <- cbind(lag(x,k=par2),x)
dum
dum1 <- dum[(par2+1):length(x),]
dum1
z <- as.data.frame(dum1)
z
mylagtitle <- 'Lag plot (k='
mylagtitle <- paste(mylagtitle,par2,sep='')
mylagtitle <- paste(mylagtitle,'), and lowess',sep='')
plot(z,main=mylagtitle)
lines(lowess(z))
dev.off()
}
bitmap(file='pic5.png')
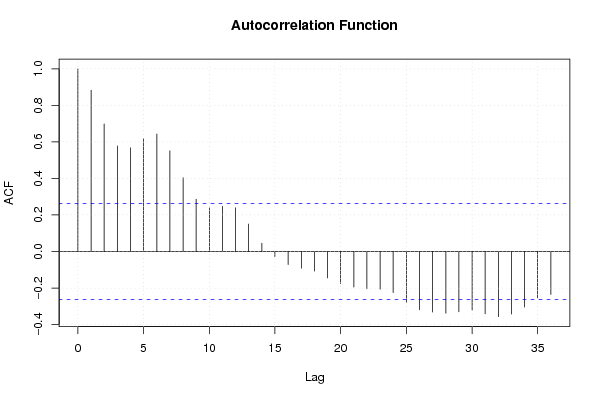
acf(x,lag.max=par2,main='Autocorrelation Function')
grid()
dev.off()
}
summary(x)
load(file='createtable')
a<-table.start()
a<-table.row.start(a)
a<-table.element(a,'Descriptive Statistics',2,TRUE)
a<-table.row.end(a)
a<-table.row.start(a)
a<-table.element(a,'# observations',header=TRUE)
a<-table.element(a,length(x))
a<-table.row.end(a)
a<-table.row.start(a)
a<-table.element(a,'minimum',header=TRUE)
a<-table.element(a,min(x))
a<-table.row.end(a)
a<-table.row.start(a)
a<-table.element(a,'Q1',header=TRUE)
a<-table.element(a,quantile(x,0.25))
a<-table.row.end(a)
a<-table.row.start(a)
a<-table.element(a,'median',header=TRUE)
a<-table.element(a,median(x))
a<-table.row.end(a)
a<-table.row.start(a)
a<-table.element(a,'mean',header=TRUE)
a<-table.element(a,mean(x))
a<-table.row.end(a)
a<-table.row.start(a)
a<-table.element(a,'Q3',header=TRUE)
a<-table.element(a,quantile(x,0.75))
a<-table.row.end(a)
a<-table.row.start(a)
a<-table.element(a,'maximum',header=TRUE)
a<-table.element(a,max(x))
a<-table.row.end(a)
a<-table.end(a)
table.save(a,file='mytable.tab')