Free Statistics
of Irreproducible Research!
Description of Statistical Computation | |||||||||||||||||||||||||||||||||||||||||||||
|---|---|---|---|---|---|---|---|---|---|---|---|---|---|---|---|---|---|---|---|---|---|---|---|---|---|---|---|---|---|---|---|---|---|---|---|---|---|---|---|---|---|---|---|---|---|
| Author's title | |||||||||||||||||||||||||||||||||||||||||||||
| Author | *The author of this computation has been verified* | ||||||||||||||||||||||||||||||||||||||||||||
| R Software Module | rwasp_kendall.wasp | ||||||||||||||||||||||||||||||||||||||||||||
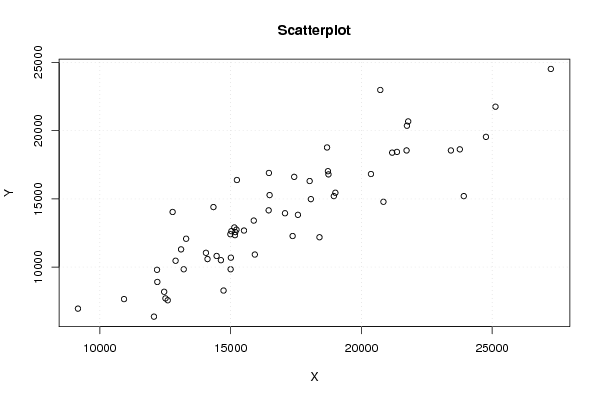
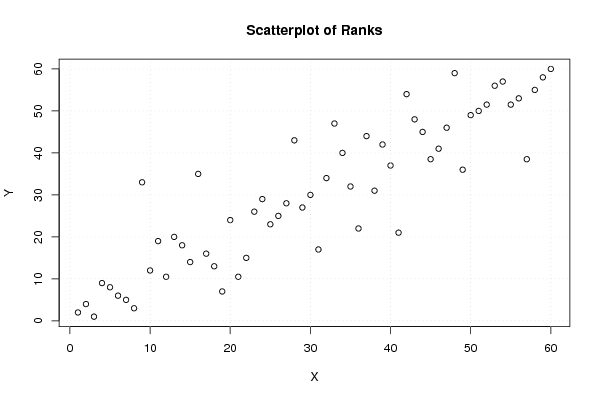
| Title produced by software | Kendall tau Rank Correlation | ||||||||||||||||||||||||||||||||||||||||||||
| Date of computation | Tue, 27 Oct 2009 17:32:47 -0600 | ||||||||||||||||||||||||||||||||||||||||||||
| Cite this page as follows | Statistical Computations at FreeStatistics.org, Office for Research Development and Education, URL https://freestatistics.org/blog/index.php?v=date/2009/Oct/28/t1256686413im0dwowoqnk4ciz.htm/, Retrieved Mon, 06 May 2024 00:09:05 +0000 | ||||||||||||||||||||||||||||||||||||||||||||
| Statistical Computations at FreeStatistics.org, Office for Research Development and Education, URL https://freestatistics.org/blog/index.php?pk=51313, Retrieved Mon, 06 May 2024 00:09:05 +0000 | |||||||||||||||||||||||||||||||||||||||||||||
| QR Codes: | |||||||||||||||||||||||||||||||||||||||||||||
|
| |||||||||||||||||||||||||||||||||||||||||||||
| Original text written by user: | |||||||||||||||||||||||||||||||||||||||||||||
| IsPrivate? | No (this computation is public) | ||||||||||||||||||||||||||||||||||||||||||||
| User-defined keywords | |||||||||||||||||||||||||||||||||||||||||||||
| Estimated Impact | 160 | ||||||||||||||||||||||||||||||||||||||||||||
Tree of Dependent Computations | |||||||||||||||||||||||||||||||||||||||||||||
| Family? (F = Feedback message, R = changed R code, M = changed R Module, P = changed Parameters, D = changed Data) | |||||||||||||||||||||||||||||||||||||||||||||
| - [Bivariate Data Series] [Bivariate dataset] [2008-01-05 23:51:08] [74be16979710d4c4e7c6647856088456] - PD [Bivariate Data Series] [Reproduce: part 1] [2009-10-27 19:04:39] [f924a0adda9c1905a1ba8f1c751261ff] - RMP [Bivariate Explorative Data Analysis] [Bivariate EDA: Pa...] [2009-10-27 21:03:03] [f924a0adda9c1905a1ba8f1c751261ff] - D [Bivariate Explorative Data Analysis] [Bivariate EDA: Pa...] [2009-10-27 22:45:19] [f924a0adda9c1905a1ba8f1c751261ff] - RMPD [Kendall tau Rank Correlation] [Kendall Rang corr...] [2009-10-27 23:32:47] [ac86848d66148c9c4c9404e0c9a511eb] [Current] | |||||||||||||||||||||||||||||||||||||||||||||
| Feedback Forum | |||||||||||||||||||||||||||||||||||||||||||||
Post a new message | |||||||||||||||||||||||||||||||||||||||||||||
Dataset | |||||||||||||||||||||||||||||||||||||||||||||
| Dataseries X: | |||||||||||||||||||||||||||||||||||||||||||||
12071.42 9166.15 15143.76 15225.09 14467.28 13301.01 12188.16 13107.96 17431.92 15168.39 14118.19 16466.02 12597.82 10926.52 17574.80 15011.15 17371.24 15512.70 14631.32 15030.76 21176.07 14058.84 18023.06 18686.89 14730.68 12461.26 18068.74 18947.52 19005.38 14344.85 17079.88 16455.76 21741.50 16491.70 18741.61 20721.60 18398.21 15001.35 18722.45 23421.24 20366.14 15242.37 20842.70 21359.82 21788.71 25125.42 21726.76 27241.50 23913.53 15926.44 24762.17 23762.22 15180.70 12784.82 12199.20 12898.14 14991.55 13208.90 12510.42 15886.08 | |||||||||||||||||||||||||||||||||||||||||||||
| Dataseries Y: | |||||||||||||||||||||||||||||||||||||||||||||
6368.04 6955.56 12904.96 12746.41 10816.00 12078.01 9801.00 11299.69 16615.21 12343.21 10588.41 16900.00 7569.00 7656.25 13829.76 10691.56 12276.64 12678.76 10506.25 12633.76 18387.36 11046.01 16307.29 18769.00 8281.00 8190.25 14981.76 15202.89 15450.49 14400.00 13947.61 14161.00 20363.29 15276.96 16796.16 22982.56 12188.16 9840.64 17030.25 18550.44 16822.09 16384.00 14786.56 18441.64 20678.44 21756.25 18550.44 24523.56 15202.89 10920.25 19544.04 18632.25 12566.41 14042.25 8911.36 10465.29 12409.96 9840.64 7708.84 13409.64 | |||||||||||||||||||||||||||||||||||||||||||||
Tables (Output of Computation) | |||||||||||||||||||||||||||||||||||||||||||||
| |||||||||||||||||||||||||||||||||||||||||||||
Figures (Output of Computation) | |||||||||||||||||||||||||||||||||||||||||||||
Input Parameters & R Code | |||||||||||||||||||||||||||||||||||||||||||||
| Parameters (Session): | |||||||||||||||||||||||||||||||||||||||||||||
| Parameters (R input): | |||||||||||||||||||||||||||||||||||||||||||||
| R code (references can be found in the software module): | |||||||||||||||||||||||||||||||||||||||||||||
library('Kendall') | |||||||||||||||||||||||||||||||||||||||||||||