Free Statistics

of Irreproducible Research!

Author's title

Author*The author of this computation has been verified*
R Software Modulerwasp_edabi.wasp
Title produced by softwareBivariate Explorative Data Analysis
Date of computationTue, 27 Oct 2009 17:29:27 -0600
Cite this page as followsStatistical Computations at FreeStatistics.org, Office for Research Development and Education, URL https://freestatistics.org/blog/index.php?v=date/2009/Oct/28/t1256686215vnmqaxst9w1zpph.htm/, Retrieved Sun, 05 May 2024 21:53:48 +0000
Statistical Computations at FreeStatistics.org, Office for Research Development and Education, URL https://freestatistics.org/blog/index.php?pk=51311, Retrieved Sun, 05 May 2024 21:53:48 +0000
QR Codes:

Original text written by user:
IsPrivate?No (this computation is public)
User-defined keywords
Estimated Impact152
Family? (F = Feedback message, R = changed R code, M = changed R Module, P = changed Parameters, D = changed Data)
-     [Bivariate Data Series] [Bivariate dataset] [2008-01-05 23:51:08] [74be16979710d4c4e7c6647856088456]
-   PD  [Bivariate Data Series] [Reproduce: part 1] [2009-10-27 19:04:39] [f924a0adda9c1905a1ba8f1c751261ff]
- RMP     [Bivariate Explorative Data Analysis] [Bivariate EDA: Pa...] [2009-10-27 21:03:03] [f924a0adda9c1905a1ba8f1c751261ff]
-    D      [Bivariate Explorative Data Analysis] [Bivariate EDA: Pa...] [2009-10-27 22:45:19] [f924a0adda9c1905a1ba8f1c751261ff]
-    D          [Bivariate Explorative Data Analysis] [Bivariate data: P...] [2009-10-27 23:29:27] [ac86848d66148c9c4c9404e0c9a511eb] [Current]
Feedback Forum

Post a new message
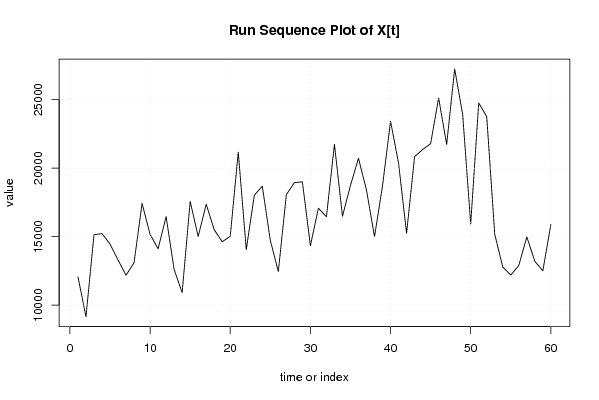
Dataseries X:
12071.42
9166.15
15143.76
15225.09
14467.28
13301.01
12188.16
13107.96
17431.92
15168.39
14118.19
16466.02
12597.82
10926.52
17574.80
15011.15
17371.24
15512.70
14631.32
15030.76
21176.07
14058.84
18023.06
18686.89
14730.68
12461.26
18068.74
18947.52
19005.38
14344.85
17079.88
16455.76
21741.50
16491.70
18741.61
20721.60
18398.21
15001.35
18722.45
23421.24
20366.14
15242.37
20842.70
21359.82
21788.71
25125.42
21726.76
27241.50
23913.53
15926.44
24762.17
23762.22
15180.70
12784.82
12199.20
12898.14
14991.55
13208.90
12510.42
15886.08
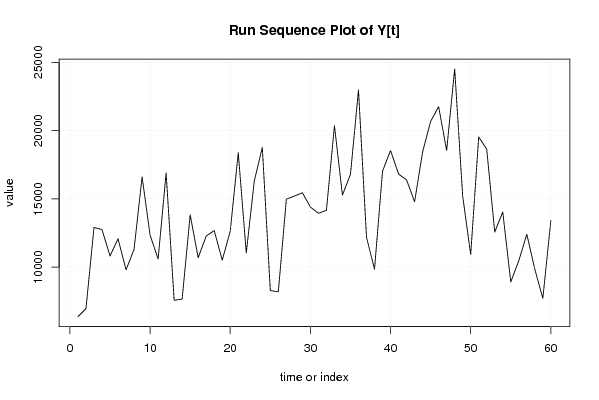
Dataseries Y:
6368.04
6955.56
12904.96
12746.41
10816.00
12078.01
9801.00
11299.69
16615.21
12343.21
10588.41
16900.00
7569.00
7656.25
13829.76
10691.56
12276.64
12678.76
10506.25
12633.76
18387.36
11046.01
16307.29
18769.00
8281.00
8190.25
14981.76
15202.89
15450.49
14400.00
13947.61
14161.00
20363.29
15276.96
16796.16
22982.56
12188.16
9840.64
17030.25
18550.44
16822.09
16384.00
14786.56
18441.64
20678.44
21756.25
18550.44
24523.56
15202.89
10920.25
19544.04
18632.25
12566.41
14042.25
8911.36
10465.29
12409.96
9840.64
7708.84
13409.64


Summary of computational transaction
Raw Inputview raw input (R code)
Raw Outputview raw output of R engine
Computing time4 seconds
R Server'Sir Ronald Aylmer Fisher' @ 193.190.124.24

\begin{tabular}{lllllllll}
\hline
Summary of computational transaction \tabularnewline
Raw Input & view raw input (R code)  \tabularnewline
Raw Output & view raw output of R engine  \tabularnewline
Computing time & 4 seconds \tabularnewline
R Server & 'Sir Ronald Aylmer Fisher' @ 193.190.124.24 \tabularnewline
\hline
\end{tabular}
%Source: https://freestatistics.org/blog/index.php?pk=51311&T=0

[TABLE]
[ROW][C]Summary of computational transaction[/C][/ROW]
[ROW][C]Raw Input[/C][C]view raw input (R code) [/C][/ROW]
[ROW][C]Raw Output[/C][C]view raw output of R engine [/C][/ROW]
[ROW][C]Computing time[/C][C]4 seconds[/C][/ROW]
[ROW][C]R Server[/C][C]'Sir Ronald Aylmer Fisher' @ 193.190.124.24[/C][/ROW]
[/TABLE]
Source: https://freestatistics.org/blog/index.php?pk=51311&T=0

Globally Unique Identifier (entire table): ba.freestatistics.org/blog/index.php?pk=51311&T=0

As an alternative you can also use a QR Code:  

The GUIDs for individual cells are displayed in the table below:

Summary of computational transaction
Raw Inputview raw input (R code)
Raw Outputview raw output of R engine
Computing time4 seconds
R Server'Sir Ronald Aylmer Fisher' @ 193.190.124.24


Model: Y[t] = c + b X[t] + e[t]
c-1905.78394104708
b0.935779300101638

\begin{tabular}{lllllllll}
\hline
Model: Y[t] = c + b X[t] + e[t] \tabularnewline
c & -1905.78394104708 \tabularnewline
b & 0.935779300101638 \tabularnewline
\hline
\end{tabular}
%Source: https://freestatistics.org/blog/index.php?pk=51311&T=1

[TABLE]
[ROW][C]Model: Y[t] = c + b X[t] + e[t][/C][/ROW]
[ROW][C]c[/C][C]-1905.78394104708[/C][/ROW]
[ROW][C]b[/C][C]0.935779300101638[/C][/ROW]
[/TABLE]
Source: https://freestatistics.org/blog/index.php?pk=51311&T=1

Globally Unique Identifier (entire table): ba.freestatistics.org/blog/index.php?pk=51311&T=1

As an alternative you can also use a QR Code:  

The GUIDs for individual cells are displayed in the table below:

Model: Y[t] = c + b X[t] + e[t]
c-1905.78394104708
b0.935779300101638


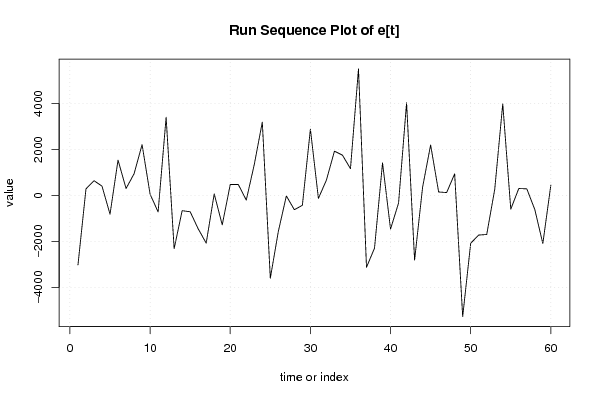
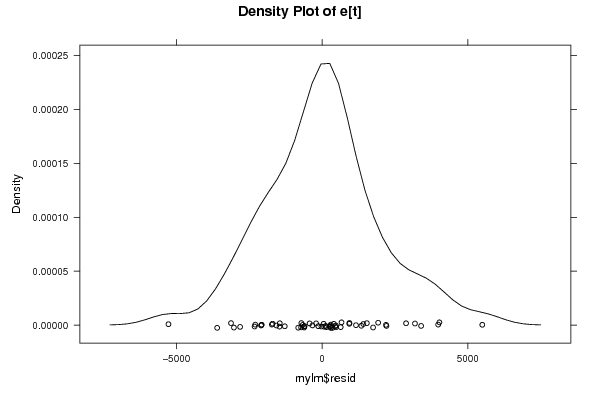
Descriptive Statistics about e[t]
# observations60
minimum-5269.11242531245
Q1-1322.18421100542
median96.4260335656036
mean5.91947787083787e-14
Q3937.81317961793
maximum5497.49959606098

\begin{tabular}{lllllllll}
\hline
Descriptive Statistics about e[t] \tabularnewline
# observations & 60 \tabularnewline
minimum & -5269.11242531245 \tabularnewline
Q1 & -1322.18421100542 \tabularnewline
median & 96.4260335656036 \tabularnewline
mean & 5.91947787083787e-14 \tabularnewline
Q3 & 937.81317961793 \tabularnewline
maximum & 5497.49959606098 \tabularnewline
\hline
\end{tabular}
%Source: https://freestatistics.org/blog/index.php?pk=51311&T=2

[TABLE]
[ROW][C]Descriptive Statistics about e[t][/C][/ROW]
[ROW][C]# observations[/C][C]60[/C][/ROW]
[ROW][C]minimum[/C][C]-5269.11242531245[/C][/ROW]
[ROW][C]Q1[/C][C]-1322.18421100542[/C][/ROW]
[ROW][C]median[/C][C]96.4260335656036[/C][/ROW]
[ROW][C]mean[/C][C]5.91947787083787e-14[/C][/ROW]
[ROW][C]Q3[/C][C]937.81317961793[/C][/ROW]
[ROW][C]maximum[/C][C]5497.49959606098[/C][/ROW]
[/TABLE]
Source: https://freestatistics.org/blog/index.php?pk=51311&T=2

Globally Unique Identifier (entire table): ba.freestatistics.org/blog/index.php?pk=51311&T=2

As an alternative you can also use a QR Code:  

The GUIDs for individual cells are displayed in the table below:

Descriptive Statistics about e[t]
# observations60
minimum-5269.11242531245
Q1-1322.18421100542
median96.4260335656036
mean5.91947787083787e-14
Q3937.81317961793
maximum5497.49959606098


Parameters (Session):
par1 = 0 ; par2 = 36 ;
Parameters (R input):
par1 = 0 ; par2 = 36 ;
R code (references can be found in the software module):
par1 <- as.numeric(par1)
par2 <- as.numeric(par2)
x <- as.ts(x)
y <- as.ts(y)
mylm <- lm(y~x)
cbind(mylm$resid)
library(lattice)
bitmap(file='pic1.png')
plot(y,type='l',main='Run Sequence Plot of Y[t]',xlab='time or index',ylab='value')
grid()
dev.off()
bitmap(file='pic1a.png')
plot(x,type='l',main='Run Sequence Plot of X[t]',xlab='time or index',ylab='value')
grid()
dev.off()
bitmap(file='pic1b.png')
plot(x,y,main='Scatter Plot',xlab='X[t]',ylab='Y[t]')
grid()
dev.off()
bitmap(file='pic1c.png')
plot(mylm$resid,type='l',main='Run Sequence Plot of e[t]',xlab='time or index',ylab='value')
grid()
dev.off()
bitmap(file='pic2.png')
hist(mylm$resid,main='Histogram of e[t]')
dev.off()
bitmap(file='pic3.png')
if (par1 > 0)
{
densityplot(~mylm$resid,col='black',main=paste('Density Plot of e[t] bw = ',par1),bw=par1)
} else {
densityplot(~mylm$resid,col='black',main='Density Plot of e[t]')
}
dev.off()
bitmap(file='pic4.png')
qqnorm(mylm$resid,main='QQ plot of e[t]')
qqline(mylm$resid)
grid()
dev.off()
if (par2 > 0)
{
bitmap(file='pic5.png')
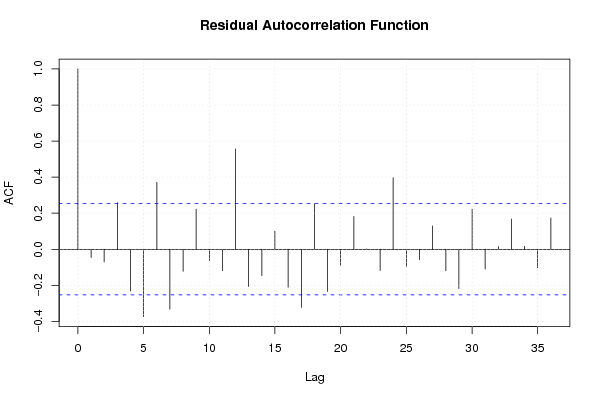
acf(mylm$resid,lag.max=par2,main='Residual Autocorrelation Function')
grid()
dev.off()
}
summary(x)
load(file='createtable')
a<-table.start()
a<-table.row.start(a)
a<-table.element(a,'Model: Y[t] = c + b X[t] + e[t]',2,TRUE)
a<-table.row.end(a)
a<-table.row.start(a)
a<-table.element(a,'c',1,TRUE)
a<-table.element(a,mylm$coeff[[1]])
a<-table.row.end(a)
a<-table.row.start(a)
a<-table.element(a,'b',1,TRUE)
a<-table.element(a,mylm$coeff[[2]])
a<-table.row.end(a)
a<-table.end(a)
table.save(a,file='mytable.tab')
a<-table.start()
a<-table.row.start(a)
a<-table.element(a,'Descriptive Statistics about e[t]',2,TRUE)
a<-table.row.end(a)
a<-table.row.start(a)
a<-table.element(a,'# observations',header=TRUE)
a<-table.element(a,length(mylm$resid))
a<-table.row.end(a)
a<-table.row.start(a)
a<-table.element(a,'minimum',header=TRUE)
a<-table.element(a,min(mylm$resid))
a<-table.row.end(a)
a<-table.row.start(a)
a<-table.element(a,'Q1',header=TRUE)
a<-table.element(a,quantile(mylm$resid,0.25))
a<-table.row.end(a)
a<-table.row.start(a)
a<-table.element(a,'median',header=TRUE)
a<-table.element(a,median(mylm$resid))
a<-table.row.end(a)
a<-table.row.start(a)
a<-table.element(a,'mean',header=TRUE)
a<-table.element(a,mean(mylm$resid))
a<-table.row.end(a)
a<-table.row.start(a)
a<-table.element(a,'Q3',header=TRUE)
a<-table.element(a,quantile(mylm$resid,0.75))
a<-table.row.end(a)
a<-table.row.start(a)
a<-table.element(a,'maximum',header=TRUE)
a<-table.element(a,max(mylm$resid))
a<-table.row.end(a)
a<-table.end(a)
table.save(a,file='mytable.tab')