Free Statistics

of Irreproducible Research!

Author's title

Author*The author of this computation has been verified*
R Software Modulerwasp_edabi.wasp
Title produced by softwareBivariate Explorative Data Analysis
Date of computationTue, 27 Oct 2009 09:24:35 -0600
Cite this page as followsStatistical Computations at FreeStatistics.org, Office for Research Development and Education, URL https://freestatistics.org/blog/index.php?v=date/2009/Oct/27/t1256657334w7qtjwb5ax7lbfe.htm/, Retrieved Tue, 07 May 2024 08:09:40 +0000
Statistical Computations at FreeStatistics.org, Office for Research Development and Education, URL https://freestatistics.org/blog/index.php?pk=51006, Retrieved Tue, 07 May 2024 08:09:40 +0000
QR Codes:

Original text written by user:
IsPrivate?No (this computation is public)
User-defined keywordsWS 4 Part 2
Estimated Impact144
Family? (F = Feedback message, R = changed R code, M = changed R Module, P = changed Parameters, D = changed Data)
-       [Bivariate Explorative Data Analysis] [WS 4 Part 2] [2009-10-27 15:24:35] [52b85b290d6f50b0921ad6729b8a5af2] [Current]
-  M D    [Bivariate Explorative Data Analysis] [WS 4 Part 2] [2009-11-02 01:02:05] [9717cb857c153ca3061376906953b329]
Feedback Forum

Post a new message
Dataseries X:
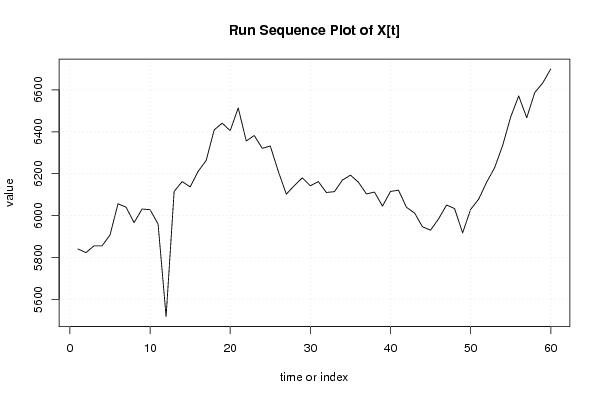
5 840
5 823
5 855
5 855
5 907
6 056
6 040
5 966
6 031
6 028
5 959
5 517
6 115
6 162
6 137
6 211
6 263
6 409
6 441
6 405
6 514
6 356
6 382
6 321
6 332
6 211
6 102
6 143
6 180
6 142
6 162
6 110
6 114
6 169
6 193
6 159
6 103
6 112
6 045
6 115
6 121
6 039
6 012
5 946
5 930
5 984
6 050
6 033
5 917
6 029
6 078
6 159
6 229
6 335
6 471
6 571
6 467
6 587
6 633
6 700
Dataseries Y:
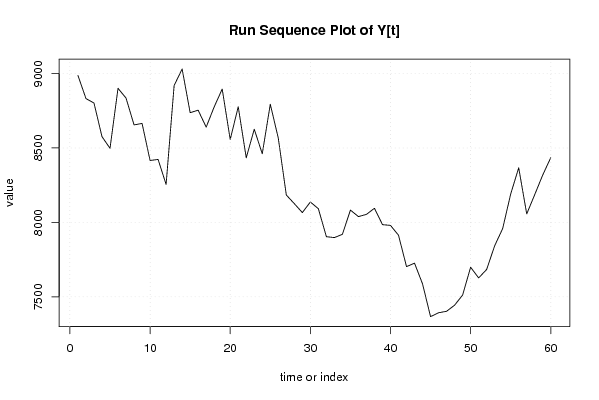
8987
8832
8802
8576
8498
8901
8835
8655
8665
8416
8423
8255
8919
9031
8737
8754
8640
8776
8896
8557
8777
8434
8626
8461
8794
8566
8184
8126
8066
8137
8092
7904
7898
7920
8083
8039
8054
8095
7985
7980
7914
7703
7726
7587
7367
7393
7403
7444
7512
7699
7627
7684
7843
7959
8191
8367
8057
8187
8319
8435


Summary of computational transaction
Raw Inputview raw input (R code)
Raw Outputview raw output of R engine
Computing time2 seconds
R Server'Gwilym Jenkins' @ 72.249.127.135

\begin{tabular}{lllllllll}
\hline
Summary of computational transaction \tabularnewline
Raw Input & view raw input (R code)  \tabularnewline
Raw Output & view raw output of R engine  \tabularnewline
Computing time & 2 seconds \tabularnewline
R Server & 'Gwilym Jenkins' @ 72.249.127.135 \tabularnewline
\hline
\end{tabular}
%Source: https://freestatistics.org/blog/index.php?pk=51006&T=0

[TABLE]
[ROW][C]Summary of computational transaction[/C][/ROW]
[ROW][C]Raw Input[/C][C]view raw input (R code) [/C][/ROW]
[ROW][C]Raw Output[/C][C]view raw output of R engine [/C][/ROW]
[ROW][C]Computing time[/C][C]2 seconds[/C][/ROW]
[ROW][C]R Server[/C][C]'Gwilym Jenkins' @ 72.249.127.135[/C][/ROW]
[/TABLE]
Source: https://freestatistics.org/blog/index.php?pk=51006&T=0

Globally Unique Identifier (entire table): ba.freestatistics.org/blog/index.php?pk=51006&T=0

As an alternative you can also use a QR Code:  

The GUIDs for individual cells are displayed in the table below:

Summary of computational transaction
Raw Inputview raw input (R code)
Raw Outputview raw output of R engine
Computing time2 seconds
R Server'Gwilym Jenkins' @ 72.249.127.135


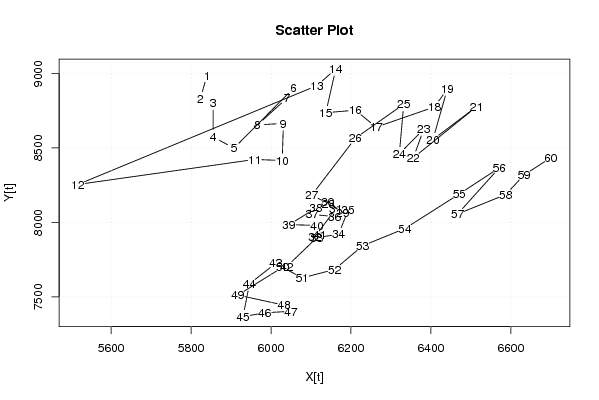
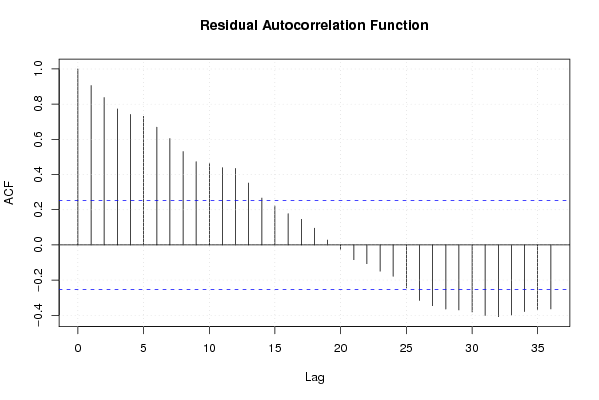
Model: Y[t] = c + b X[t] + e[t]
c6109.49579678832
b0.347228772497267

\begin{tabular}{lllllllll}
\hline
Model: Y[t] = c + b X[t] + e[t] \tabularnewline
c & 6109.49579678832 \tabularnewline
b & 0.347228772497267 \tabularnewline
\hline
\end{tabular}
%Source: https://freestatistics.org/blog/index.php?pk=51006&T=1

[TABLE]
[ROW][C]Model: Y[t] = c + b X[t] + e[t][/C][/ROW]
[ROW][C]c[/C][C]6109.49579678832[/C][/ROW]
[ROW][C]b[/C][C]0.347228772497267[/C][/ROW]
[/TABLE]
Source: https://freestatistics.org/blog/index.php?pk=51006&T=1

Globally Unique Identifier (entire table): ba.freestatistics.org/blog/index.php?pk=51006&T=1

As an alternative you can also use a QR Code:  

The GUIDs for individual cells are displayed in the table below:

Model: Y[t] = c + b X[t] + e[t]
c6109.49579678832
b0.347228772497267


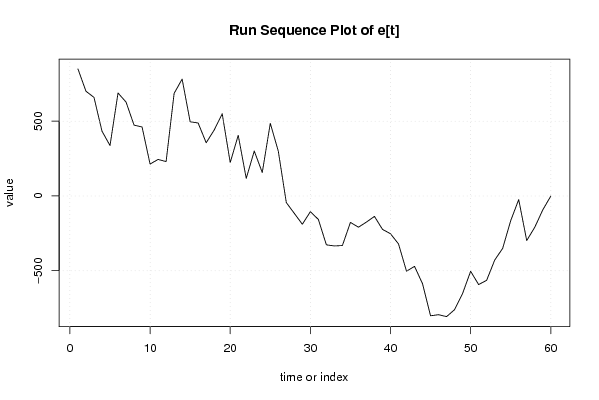
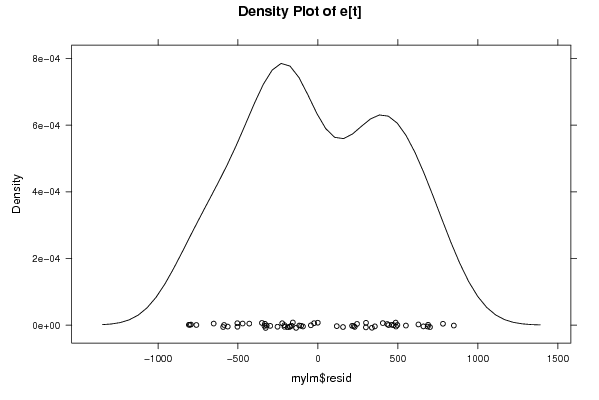
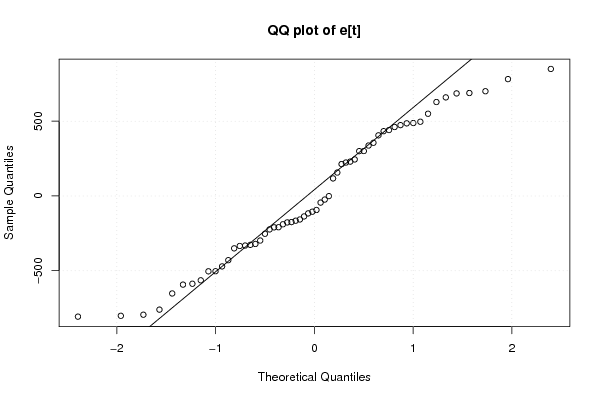
Descriptive Statistics about e[t]
# observations60
minimum-807.229870396786
Q1-328.185221140957
median-99.4195811146138
mean-2.94791950543559e-15
Q3412.611919433407
maximum849.688171827654

\begin{tabular}{lllllllll}
\hline
Descriptive Statistics about e[t] \tabularnewline
# observations & 60 \tabularnewline
minimum & -807.229870396786 \tabularnewline
Q1 & -328.185221140957 \tabularnewline
median & -99.4195811146138 \tabularnewline
mean & -2.94791950543559e-15 \tabularnewline
Q3 & 412.611919433407 \tabularnewline
maximum & 849.688171827654 \tabularnewline
\hline
\end{tabular}
%Source: https://freestatistics.org/blog/index.php?pk=51006&T=2

[TABLE]
[ROW][C]Descriptive Statistics about e[t][/C][/ROW]
[ROW][C]# observations[/C][C]60[/C][/ROW]
[ROW][C]minimum[/C][C]-807.229870396786[/C][/ROW]
[ROW][C]Q1[/C][C]-328.185221140957[/C][/ROW]
[ROW][C]median[/C][C]-99.4195811146138[/C][/ROW]
[ROW][C]mean[/C][C]-2.94791950543559e-15[/C][/ROW]
[ROW][C]Q3[/C][C]412.611919433407[/C][/ROW]
[ROW][C]maximum[/C][C]849.688171827654[/C][/ROW]
[/TABLE]
Source: https://freestatistics.org/blog/index.php?pk=51006&T=2

Globally Unique Identifier (entire table): ba.freestatistics.org/blog/index.php?pk=51006&T=2

As an alternative you can also use a QR Code:  

The GUIDs for individual cells are displayed in the table below:

Descriptive Statistics about e[t]
# observations60
minimum-807.229870396786
Q1-328.185221140957
median-99.4195811146138
mean-2.94791950543559e-15
Q3412.611919433407
maximum849.688171827654


Parameters (Session):
par1 = 0 ; par2 = 36 ;
Parameters (R input):
par1 = 0 ; par2 = 36 ;
R code (references can be found in the software module):
par1 <- as.numeric(par1)
par2 <- as.numeric(par2)
x <- as.ts(x)
y <- as.ts(y)
mylm <- lm(y~x)
cbind(mylm$resid)
library(lattice)
bitmap(file='pic1.png')
plot(y,type='l',main='Run Sequence Plot of Y[t]',xlab='time or index',ylab='value')
grid()
dev.off()
bitmap(file='pic1a.png')
plot(x,type='l',main='Run Sequence Plot of X[t]',xlab='time or index',ylab='value')
grid()
dev.off()
bitmap(file='pic1b.png')
plot(x,y,main='Scatter Plot',xlab='X[t]',ylab='Y[t]')
grid()
dev.off()
bitmap(file='pic1c.png')
plot(mylm$resid,type='l',main='Run Sequence Plot of e[t]',xlab='time or index',ylab='value')
grid()
dev.off()
bitmap(file='pic2.png')
hist(mylm$resid,main='Histogram of e[t]')
dev.off()
bitmap(file='pic3.png')
if (par1 > 0)
{
densityplot(~mylm$resid,col='black',main=paste('Density Plot of e[t] bw = ',par1),bw=par1)
} else {
densityplot(~mylm$resid,col='black',main='Density Plot of e[t]')
}
dev.off()
bitmap(file='pic4.png')
qqnorm(mylm$resid,main='QQ plot of e[t]')
qqline(mylm$resid)
grid()
dev.off()
if (par2 > 0)
{
bitmap(file='pic5.png')
acf(mylm$resid,lag.max=par2,main='Residual Autocorrelation Function')
grid()
dev.off()
}
summary(x)
load(file='createtable')
a<-table.start()
a<-table.row.start(a)
a<-table.element(a,'Model: Y[t] = c + b X[t] + e[t]',2,TRUE)
a<-table.row.end(a)
a<-table.row.start(a)
a<-table.element(a,'c',1,TRUE)
a<-table.element(a,mylm$coeff[[1]])
a<-table.row.end(a)
a<-table.row.start(a)
a<-table.element(a,'b',1,TRUE)
a<-table.element(a,mylm$coeff[[2]])
a<-table.row.end(a)
a<-table.end(a)
table.save(a,file='mytable.tab')
a<-table.start()
a<-table.row.start(a)
a<-table.element(a,'Descriptive Statistics about e[t]',2,TRUE)
a<-table.row.end(a)
a<-table.row.start(a)
a<-table.element(a,'# observations',header=TRUE)
a<-table.element(a,length(mylm$resid))
a<-table.row.end(a)
a<-table.row.start(a)
a<-table.element(a,'minimum',header=TRUE)
a<-table.element(a,min(mylm$resid))
a<-table.row.end(a)
a<-table.row.start(a)
a<-table.element(a,'Q1',header=TRUE)
a<-table.element(a,quantile(mylm$resid,0.25))
a<-table.row.end(a)
a<-table.row.start(a)
a<-table.element(a,'median',header=TRUE)
a<-table.element(a,median(mylm$resid))
a<-table.row.end(a)
a<-table.row.start(a)
a<-table.element(a,'mean',header=TRUE)
a<-table.element(a,mean(mylm$resid))
a<-table.row.end(a)
a<-table.row.start(a)
a<-table.element(a,'Q3',header=TRUE)
a<-table.element(a,quantile(mylm$resid,0.75))
a<-table.row.end(a)
a<-table.row.start(a)
a<-table.element(a,'maximum',header=TRUE)
a<-table.element(a,max(mylm$resid))
a<-table.row.end(a)
a<-table.end(a)
table.save(a,file='mytable.tab')