Free Statistics
of Irreproducible Research!
Description of Statistical Computation | |||||||||||||||||||||||||||||||||||||||||||||
|---|---|---|---|---|---|---|---|---|---|---|---|---|---|---|---|---|---|---|---|---|---|---|---|---|---|---|---|---|---|---|---|---|---|---|---|---|---|---|---|---|---|---|---|---|---|
| Author's title | |||||||||||||||||||||||||||||||||||||||||||||
| Author | *The author of this computation has been verified* | ||||||||||||||||||||||||||||||||||||||||||||
| R Software Module | rwasp_univariatedataseries.wasp | ||||||||||||||||||||||||||||||||||||||||||||
| Title produced by software | Univariate Data Series | ||||||||||||||||||||||||||||||||||||||||||||
| Date of computation | Sat, 24 Oct 2009 14:24:47 -0600 | ||||||||||||||||||||||||||||||||||||||||||||
| Cite this page as follows | Statistical Computations at FreeStatistics.org, Office for Research Development and Education, URL https://freestatistics.org/blog/index.php?v=date/2009/Oct/24/t1256416067ytmv1nkngcyy1ww.htm/, Retrieved Fri, 03 May 2024 10:53:25 +0000 | ||||||||||||||||||||||||||||||||||||||||||||
| Statistical Computations at FreeStatistics.org, Office for Research Development and Education, URL https://freestatistics.org/blog/index.php?pk=50238, Retrieved Fri, 03 May 2024 10:53:25 +0000 | |||||||||||||||||||||||||||||||||||||||||||||
| QR Codes: | |||||||||||||||||||||||||||||||||||||||||||||
|
| |||||||||||||||||||||||||||||||||||||||||||||
| Original text written by user: | |||||||||||||||||||||||||||||||||||||||||||||
| IsPrivate? | No (this computation is public) | ||||||||||||||||||||||||||||||||||||||||||||
| User-defined keywords | |||||||||||||||||||||||||||||||||||||||||||||
| Estimated Impact | 149 | ||||||||||||||||||||||||||||||||||||||||||||
Tree of Dependent Computations | |||||||||||||||||||||||||||||||||||||||||||||
| Family? (F = Feedback message, R = changed R code, M = changed R Module, P = changed Parameters, D = changed Data) | |||||||||||||||||||||||||||||||||||||||||||||
| - [Univariate Data Series] [SHWWS2] [2009-10-13 19:25:22] [f966872135bb25240f339c0c372beeec] - D [Univariate Data Series] [SHWWS2.2] [2009-10-13 19:36:24] [f966872135bb25240f339c0c372beeec] - PD [Univariate Data Series] [SHWWS3V2] [2009-10-24 20:24:47] [ad87854c04c4a917385375bf83f61258] [Current] - RMPD [Harrell-Davis Quantiles] [SHWWS3V3.2] [2009-10-24 20:49:35] [f966872135bb25240f339c0c372beeec] - RMPD [Histogram] [SHWWS3V3.2.1] [2009-10-24 20:51:42] [f966872135bb25240f339c0c372beeec] | |||||||||||||||||||||||||||||||||||||||||||||
| Feedback Forum | |||||||||||||||||||||||||||||||||||||||||||||
Post a new message | |||||||||||||||||||||||||||||||||||||||||||||
Dataset | |||||||||||||||||||||||||||||||||||||||||||||
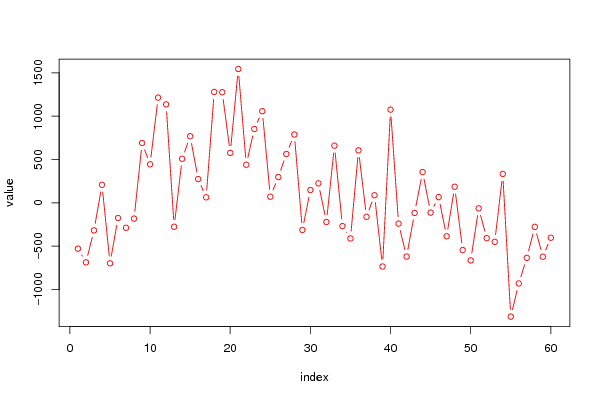
| Dataseries X: | |||||||||||||||||||||||||||||||||||||||||||||
-529 -687 -318 208 -698 -175 -288 -182 691 445 1215 1137 -276 509 769 275 64 1281 1277 577 1546 440 853 1058 71 298 564 789 -313 148 225 -221 660 -269 -411 606 -161 88 -735 1076 -240 -620 -116 355 -113 66 -386 186 -545 -664 -64 -408 -450 334 -1314 -931 -635 -277 -622 -403 | |||||||||||||||||||||||||||||||||||||||||||||
Tables (Output of Computation) | |||||||||||||||||||||||||||||||||||||||||||||
| |||||||||||||||||||||||||||||||||||||||||||||
Figures (Output of Computation) | |||||||||||||||||||||||||||||||||||||||||||||
Input Parameters & R Code | |||||||||||||||||||||||||||||||||||||||||||||
| Parameters (Session): | |||||||||||||||||||||||||||||||||||||||||||||
| par1 = Y[t] - X[t] = c + e[t] ; par2 = http://www.belgostat.be ; | |||||||||||||||||||||||||||||||||||||||||||||
| Parameters (R input): | |||||||||||||||||||||||||||||||||||||||||||||
| par1 = Y[t] - X[t] = c + e[t] ; par2 = http://www.belgostat.be ; par3 = ; | |||||||||||||||||||||||||||||||||||||||||||||
| R code (references can be found in the software module): | |||||||||||||||||||||||||||||||||||||||||||||
bitmap(file='test1.png') | |||||||||||||||||||||||||||||||||||||||||||||