Free Statistics

of Irreproducible Research!

Author's title

Author*Unverified author*
R Software Modulerwasp_edauni.wasp
Title produced by softwareUnivariate Explorative Data Analysis
Date of computationTue, 20 Oct 2009 14:33:15 -0600
Cite this page as followsStatistical Computations at FreeStatistics.org, Office for Research Development and Education, URL https://freestatistics.org/blog/index.php?v=date/2009/Oct/20/t1256070846616sxst1cu9up05.htm/, Retrieved Fri, 03 May 2024 02:49:39 +0000
Statistical Computations at FreeStatistics.org, Office for Research Development and Education, URL https://freestatistics.org/blog/index.php?pk=49140, Retrieved Fri, 03 May 2024 02:49:39 +0000
QR Codes:

Original text written by user:
IsPrivate?No (this computation is public)
User-defined keywords
Estimated Impact107
Family? (F = Feedback message, R = changed R code, M = changed R Module, P = changed Parameters, D = changed Data)
-     [Univariate Data Series] [ws2:dollarkoers] [2009-10-07 14:57:42] [f14ab336a996fc02ebda5a25ed16c051]
- RMPD    [Univariate Explorative Data Analysis] [ws3- assumpties Y...] [2009-10-20 20:33:15] [d41d8cd98f00b204e9800998ecf8427e] [Current]
-    D      [Univariate Explorative Data Analysis] [ws3- assumpties e...] [2009-10-20 20:40:37] [74be16979710d4c4e7c6647856088456]
Feedback Forum

Post a new message
Dataseries X:
1365.556988
1396.46943
1518.569954
1607.900768
1549.87866
1561.198482
1577.38749
1506.526596
1495.708632
1462.537125
1471.210288
1504.872684
1502.475296
1432.13994
1458.364282
1496.310192
1547.634816
1524.06477
1555.18366
1597.905078
1647.33
1585.1968
1598.488416
1648.967865
1677.176787
1719.358518
1788.694303
1871.515746
1851.265584
1888.73541
1863.08319
1978.26934
2041.701254
2032.294131
2086.176168
1981.483364
2080.397952
2190.474282
2148.841876
2155.23811
2029.258968
1998.162276
2044.812738
2158.49025
2182.989354
2086.046125
1982.80941
1919.001325
1748.606717
1291.074986
1124.286528
1180.042158
1145.941362
1029.486555
988.05465
1118.9077
1231.78965
1298.035776
1318.383216
1440.668496
1521.07371


Summary of computational transaction
Raw Inputview raw input (R code)
Raw Outputview raw output of R engine
Computing time3 seconds
R Server'Sir Ronald Aylmer Fisher' @ 193.190.124.24

\begin{tabular}{lllllllll}
\hline
Summary of computational transaction \tabularnewline
Raw Input & view raw input (R code)  \tabularnewline
Raw Output & view raw output of R engine  \tabularnewline
Computing time & 3 seconds \tabularnewline
R Server & 'Sir Ronald Aylmer Fisher' @ 193.190.124.24 \tabularnewline
\hline
\end{tabular}
%Source: https://freestatistics.org/blog/index.php?pk=49140&T=0

[TABLE]
[ROW][C]Summary of computational transaction[/C][/ROW]
[ROW][C]Raw Input[/C][C]view raw input (R code) [/C][/ROW]
[ROW][C]Raw Output[/C][C]view raw output of R engine [/C][/ROW]
[ROW][C]Computing time[/C][C]3 seconds[/C][/ROW]
[ROW][C]R Server[/C][C]'Sir Ronald Aylmer Fisher' @ 193.190.124.24[/C][/ROW]
[/TABLE]
Source: https://freestatistics.org/blog/index.php?pk=49140&T=0

Globally Unique Identifier (entire table): ba.freestatistics.org/blog/index.php?pk=49140&T=0

As an alternative you can also use a QR Code:  

The GUIDs for individual cells are displayed in the table below:

Summary of computational transaction
Raw Inputview raw input (R code)
Raw Outputview raw output of R engine
Computing time3 seconds
R Server'Sir Ronald Aylmer Fisher' @ 193.190.124.24


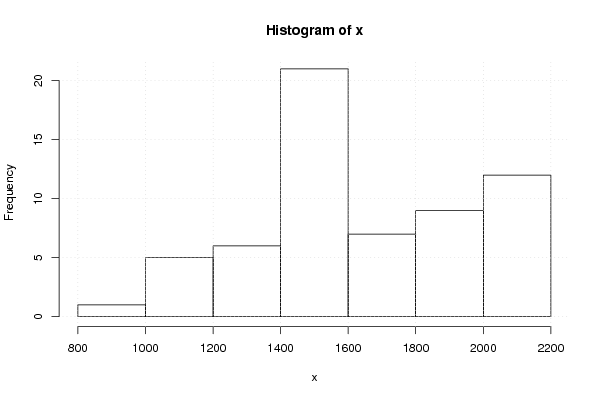
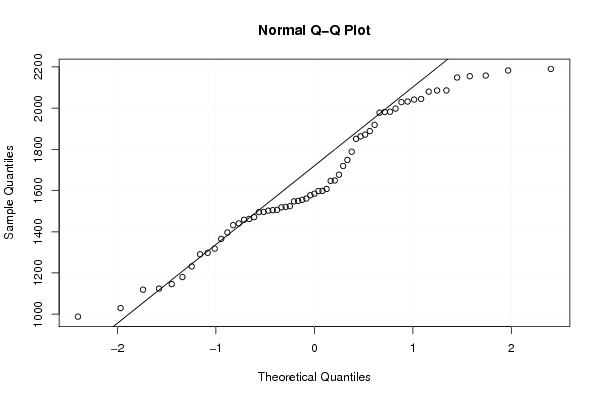
Descriptive Statistics
# observations61
minimum988.05465
Q11462.537125
median1585.1968
mean1652.53288814754
Q31978.26934
maximum2190.474282

\begin{tabular}{lllllllll}
\hline
Descriptive Statistics \tabularnewline
# observations & 61 \tabularnewline
minimum & 988.05465 \tabularnewline
Q1 & 1462.537125 \tabularnewline
median & 1585.1968 \tabularnewline
mean & 1652.53288814754 \tabularnewline
Q3 & 1978.26934 \tabularnewline
maximum & 2190.474282 \tabularnewline
\hline
\end{tabular}
%Source: https://freestatistics.org/blog/index.php?pk=49140&T=1

[TABLE]
[ROW][C]Descriptive Statistics[/C][/ROW]
[ROW][C]# observations[/C][C]61[/C][/ROW]
[ROW][C]minimum[/C][C]988.05465[/C][/ROW]
[ROW][C]Q1[/C][C]1462.537125[/C][/ROW]
[ROW][C]median[/C][C]1585.1968[/C][/ROW]
[ROW][C]mean[/C][C]1652.53288814754[/C][/ROW]
[ROW][C]Q3[/C][C]1978.26934[/C][/ROW]
[ROW][C]maximum[/C][C]2190.474282[/C][/ROW]
[/TABLE]
Source: https://freestatistics.org/blog/index.php?pk=49140&T=1

Globally Unique Identifier (entire table): ba.freestatistics.org/blog/index.php?pk=49140&T=1

As an alternative you can also use a QR Code:  

The GUIDs for individual cells are displayed in the table below:

Descriptive Statistics
# observations61
minimum988.05465
Q11462.537125
median1585.1968
mean1652.53288814754
Q31978.26934
maximum2190.474282


Parameters (Session):
par1 = 1 ; par2 = 36 ;
Parameters (R input):
par1 = 1 ; par2 = 36 ;
R code (references can be found in the software module):
par1 <- as.numeric(par1)
par2 <- as.numeric(par2)
x <- as.ts(x)
library(lattice)
bitmap(file='pic1.png')
plot(x,type='l',main='Run Sequence Plot',xlab='time or index',ylab='value')
grid()
dev.off()
bitmap(file='pic2.png')
hist(x)
grid()
dev.off()
bitmap(file='pic3.png')
if (par1 > 0)
{
densityplot(~x,col='black',main=paste('Density Plot bw = ',par1),bw=par1)
} else {
densityplot(~x,col='black',main='Density Plot')
}
dev.off()
bitmap(file='pic4.png')
qqnorm(x)
qqline(x)
grid()
dev.off()
if (par2 > 0)
{
bitmap(file='lagplot1.png')
dum <- cbind(lag(x,k=1),x)
dum
dum1 <- dum[2:length(x),]
dum1
z <- as.data.frame(dum1)
z
plot(z,main='Lag plot (k=1), lowess, and regression line')
lines(lowess(z))
abline(lm(z))
dev.off()
if (par2 > 1) {
bitmap(file='lagplotpar2.png')
dum <- cbind(lag(x,k=par2),x)
dum
dum1 <- dum[(par2+1):length(x),]
dum1
z <- as.data.frame(dum1)
z
mylagtitle <- 'Lag plot (k='
mylagtitle <- paste(mylagtitle,par2,sep='')
mylagtitle <- paste(mylagtitle,'), and lowess',sep='')
plot(z,main=mylagtitle)
lines(lowess(z))
dev.off()
}
bitmap(file='pic5.png')
acf(x,lag.max=par2,main='Autocorrelation Function')
grid()
dev.off()
}
summary(x)
load(file='createtable')
a<-table.start()
a<-table.row.start(a)
a<-table.element(a,'Descriptive Statistics',2,TRUE)
a<-table.row.end(a)
a<-table.row.start(a)
a<-table.element(a,'# observations',header=TRUE)
a<-table.element(a,length(x))
a<-table.row.end(a)
a<-table.row.start(a)
a<-table.element(a,'minimum',header=TRUE)
a<-table.element(a,min(x))
a<-table.row.end(a)
a<-table.row.start(a)
a<-table.element(a,'Q1',header=TRUE)
a<-table.element(a,quantile(x,0.25))
a<-table.row.end(a)
a<-table.row.start(a)
a<-table.element(a,'median',header=TRUE)
a<-table.element(a,median(x))
a<-table.row.end(a)
a<-table.row.start(a)
a<-table.element(a,'mean',header=TRUE)
a<-table.element(a,mean(x))
a<-table.row.end(a)
a<-table.row.start(a)
a<-table.element(a,'Q3',header=TRUE)
a<-table.element(a,quantile(x,0.75))
a<-table.row.end(a)
a<-table.row.start(a)
a<-table.element(a,'maximum',header=TRUE)
a<-table.element(a,max(x))
a<-table.row.end(a)
a<-table.end(a)
table.save(a,file='mytable.tab')