Free Statistics

of Irreproducible Research!

Author's title

Author*Unverified author*
R Software Modulerwasp_density.wasp
Title produced by softwareKernel Density Estimation
Date of computationTue, 20 Oct 2009 13:21:14 -0600
Cite this page as followsStatistical Computations at FreeStatistics.org, Office for Research Development and Education, URL https://freestatistics.org/blog/index.php?v=date/2009/Oct/20/t1256066534ddtzhytyv9u2yl7.htm/, Retrieved Fri, 03 May 2024 02:14:21 +0000
Statistical Computations at FreeStatistics.org, Office for Research Development and Education, URL https://freestatistics.org/blog/index.php?pk=49049, Retrieved Fri, 03 May 2024 02:14:21 +0000
QR Codes:

Original text written by user:
IsPrivate?No (this computation is public)
User-defined keywords
Estimated Impact91
Family? (F = Feedback message, R = changed R code, M = changed R Module, P = changed Parameters, D = changed Data)
-     [Univariate Data Series] [WS2_Rente op lang...] [2009-10-11 12:09:41] [517ac0676608e46c618c738721d88e41]
- RMPD    [Kernel Density Estimation] [WS3.3] [2009-10-20 19:21:14] [5d37783481a916b2505b66314b556267] [Current]
Feedback Forum

Post a new message
Dataseries X:
-1.561433447
-1.503623188
-1.484063745
-1.503984064
-1.491935484
-1.5625
-1.556603774
-1.547619048
-1.561032864
-1.556603774
-1.565420561
-1.561032864
-1.561032864
-1.519607843
-1.50990099
-1.458333333
-1.514778325
-1.524390244
-1.538461538
-1.538461538
-1.538461538
-1.538461538
-1.556603774
-1.565420561
-1.561032864
-1.547619048
-1.543062201
-1.547619048
-1.543062201
-1.538461538
-1.533816425
-1.538461538
-1.543062201
-1.552132701
-1.590909091
-1.58677686
-1.585365854
-1.6
-1.554054054
-1.590909091
-1.600719424
-1.589655172
-1.592409241
-1.55483871
-1.57120743
-1.556547619
-1.574074074
-1.560941828
-1.546321526
-1.564171123
-1.544502618
-1.535989717
-1.557788945
-1.544117647
-1.533816425
-1.576212471
-1.624726477
-1.636069114
-1.624726477
-1.6507431
-1.618942731
-1.569767442
-1.582568807
-1.632321041
-1.6507431
-1.645299145
-1.648676171
-1.605263158
-1.609014675
-1.733590734
-1.5
-1.485239852


Summary of computational transaction
Raw Inputview raw input (R code)
Raw Outputview raw output of R engine
Computing time4 seconds
R Server'RServer@AstonUniversity' @ vre.aston.ac.uk

\begin{tabular}{lllllllll}
\hline
Summary of computational transaction \tabularnewline
Raw Input & view raw input (R code)  \tabularnewline
Raw Output & view raw output of R engine  \tabularnewline
Computing time & 4 seconds \tabularnewline
R Server & 'RServer@AstonUniversity' @ vre.aston.ac.uk \tabularnewline
\hline
\end{tabular}
%Source: https://freestatistics.org/blog/index.php?pk=49049&T=0

[TABLE]
[ROW][C]Summary of computational transaction[/C][/ROW]
[ROW][C]Raw Input[/C][C]view raw input (R code) [/C][/ROW]
[ROW][C]Raw Output[/C][C]view raw output of R engine [/C][/ROW]
[ROW][C]Computing time[/C][C]4 seconds[/C][/ROW]
[ROW][C]R Server[/C][C]'RServer@AstonUniversity' @ vre.aston.ac.uk[/C][/ROW]
[/TABLE]
Source: https://freestatistics.org/blog/index.php?pk=49049&T=0

Globally Unique Identifier (entire table): ba.freestatistics.org/blog/index.php?pk=49049&T=0

As an alternative you can also use a QR Code:  

The GUIDs for individual cells are displayed in the table below:

Summary of computational transaction
Raw Inputview raw input (R code)
Raw Outputview raw output of R engine
Computing time4 seconds
R Server'RServer@AstonUniversity' @ vre.aston.ac.uk


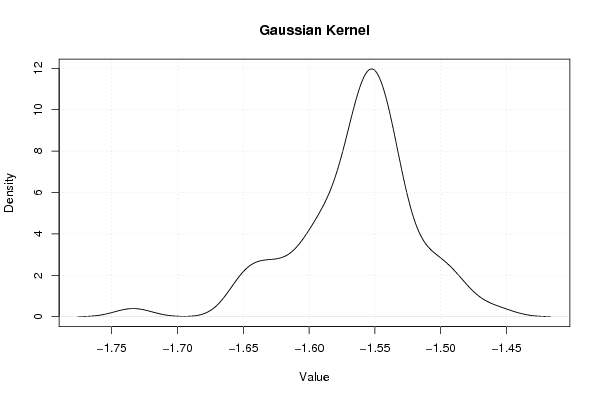
Properties of Density Trace
Bandwidth0.0140015625774035
#Observations72

\begin{tabular}{lllllllll}
\hline
Properties of Density Trace \tabularnewline
Bandwidth & 0.0140015625774035 \tabularnewline
#Observations & 72 \tabularnewline
\hline
\end{tabular}
%Source: https://freestatistics.org/blog/index.php?pk=49049&T=1

[TABLE]
[ROW][C]Properties of Density Trace[/C][/ROW]
[ROW][C]Bandwidth[/C][C]0.0140015625774035[/C][/ROW]
[ROW][C]#Observations[/C][C]72[/C][/ROW]
[/TABLE]
Source: https://freestatistics.org/blog/index.php?pk=49049&T=1

Globally Unique Identifier (entire table): ba.freestatistics.org/blog/index.php?pk=49049&T=1

As an alternative you can also use a QR Code:  

The GUIDs for individual cells are displayed in the table below:

Properties of Density Trace
Bandwidth0.0140015625774035
#Observations72


Parameters (Session):
par1 = Rente op langerlopende herfinancieringstransacties ; par2 = http://www.nbb.be/belgostat/PublicatieSelectieLinker?LinkID=741000054|910000082&Lang=N ; par3 = Voornaamste monetaire beleidstarieven van het ESCB (procenten per jaar) ;
Parameters (R input):
par1 = 0 ;
R code (references can be found in the software module):
if (par1 == '0') bw <- 'nrd0'
if (par1 != '0') bw <- as.numeric(par1)
bitmap(file='density1.png')
mydensity1<-density(x,bw=bw,kernel='gaussian',na.rm=TRUE)
plot(mydensity1,main='Gaussian Kernel',xlab=xlab,ylab=ylab)
grid()
dev.off()
mydensity1
bitmap(file='density2.png')
mydensity2<-density(x,bw=bw,kernel='epanechnikov',na.rm=TRUE)
plot(mydensity2,main='Epanechnikov Kernel',xlab=xlab,ylab=ylab)
grid()
dev.off()
bitmap(file='density3.png')
mydensity3<-density(x,bw=bw,kernel='rectangular',na.rm=TRUE)
plot(mydensity3,main='Rectangular Kernel',xlab=xlab,ylab=ylab)
grid()
dev.off()
bitmap(file='density4.png')
mydensity4<-density(x,bw=bw,kernel='triangular',na.rm=TRUE)
plot(mydensity4,main='Triangular Kernel',xlab=xlab,ylab=ylab)
grid()
dev.off()
bitmap(file='density5.png')
mydensity5<-density(x,bw=bw,kernel='biweight',na.rm=TRUE)
plot(mydensity5,main='Biweight Kernel',xlab=xlab,ylab=ylab)
grid()
dev.off()
bitmap(file='density6.png')
mydensity6<-density(x,bw=bw,kernel='cosine',na.rm=TRUE)
plot(mydensity6,main='Cosine Kernel',xlab=xlab,ylab=ylab)
grid()
dev.off()
bitmap(file='density7.png')
mydensity7<-density(x,bw=bw,kernel='optcosine',na.rm=TRUE)
plot(mydensity7,main='Optcosine Kernel',xlab=xlab,ylab=ylab)
grid()
dev.off()
load(file='createtable')
a<-table.start()
a<-table.row.start(a)
a<-table.element(a,'Properties of Density Trace',2,TRUE)
a<-table.row.end(a)
a<-table.row.start(a)
a<-table.element(a,'Bandwidth',header=TRUE)
a<-table.element(a,mydensity1$bw)
a<-table.row.end(a)
a<-table.row.start(a)
a<-table.element(a,'#Observations',header=TRUE)
a<-table.element(a,mydensity1$n)
a<-table.row.end(a)
a<-table.end(a)
table.save(a,file='mytable.tab')