Free Statistics

of Irreproducible Research!

Author's title

Author*The author of this computation has been verified*
R Software Modulerwasp_centraltendency.wasp
Title produced by softwareCentral Tendency
Date of computationTue, 20 Oct 2009 12:41:52 -0600
Cite this page as followsStatistical Computations at FreeStatistics.org, Office for Research Development and Education, URL https://freestatistics.org/blog/index.php?v=date/2009/Oct/20/t12560642251nnx9lx41r6ruh0.htm/, Retrieved Thu, 02 May 2024 21:16:35 +0000
Statistical Computations at FreeStatistics.org, Office for Research Development and Education, URL https://freestatistics.org/blog/index.php?pk=48978, Retrieved Thu, 02 May 2024 21:16:35 +0000
QR Codes:

Original text written by user:
IsPrivate?No (this computation is public)
User-defined keywordsY[t]: werkloosheidsgraad mannen X[t]: werkloosheidsgraad vrouwen
Estimated Impact137
Family? (F = Feedback message, R = changed R code, M = changed R Module, P = changed Parameters, D = changed Data)
-     [Bivariate Data Series] [Bivariate dataset] [2008-01-05 23:51:08] [74be16979710d4c4e7c6647856088456]
F RMPD  [Univariate Explorative Data Analysis] [Colombia Coffee] [2008-01-07 14:21:11] [74be16979710d4c4e7c6647856088456]
F RMPD    [Univariate Data Series] [] [2009-10-14 08:30:28] [74be16979710d4c4e7c6647856088456]
- RMP       [Histogram] [Histogram] [2009-10-16 09:23:58] [4395c69e961f9a13a0559fd2f0a72538]
- RMPD        [Quartiles] [Quartiles] [2009-10-16 09:37:48] [4395c69e961f9a13a0559fd2f0a72538]
- RM            [Percentiles] [Percentiles] [2009-10-16 09:44:59] [4395c69e961f9a13a0559fd2f0a72538]
- RM D            [Central Tendency] [Central Tendency ...] [2009-10-20 17:54:00] [4395c69e961f9a13a0559fd2f0a72538]
-    D                [Central Tendency] [Central Tendency ...] [2009-10-20 18:41:52] [d1081bd6cdf1fed9ed45c42dbd523bf1] [Current]
- RM D                  [Univariate Data Series] [Grafiek E[t]: Y[t...] [2009-10-20 18:53:38] [4395c69e961f9a13a0559fd2f0a72538]
- RM D                    [Central Tendency] [Central Tendency ...] [2009-10-20 18:55:54] [4395c69e961f9a13a0559fd2f0a72538]
- RM                        [Variability] [Variability e[t]:...] [2009-10-20 19:03:21] [4395c69e961f9a13a0559fd2f0a72538]
- RMP                         [Univariate Explorative Data Analysis] [EDA e[t] : Y[t]/X[t]] [2009-10-20 19:07:22] [4395c69e961f9a13a0559fd2f0a72538]
- RMP                         [Univariate Explorative Data Analysis] [EDA e[t]: Y[t]/X[t]] [2009-10-20 19:10:52] [4395c69e961f9a13a0559fd2f0a72538]
- RMP                           [Harrell-Davis Quantiles] [Harrell Davis Qua...] [2009-10-20 19:22:36] [4395c69e961f9a13a0559fd2f0a72538]
Feedback Forum

Post a new message
Dataseries X:
0,924050633
0,835164835
0,79787234
0,808510638
0,868131868
0,877777778
0,870967742
0,828282828
0,816326531
0,806451613
0,819277108
0,8125
0,776470588
0,730769231
0,720720721
0,743119266
0,77
0,815217391
0,826086957
0,821052632
0,8125
0,821052632
0,824175824
0,842696629
0,788888889
0,742574257
0,72815534
0,745098039
0,802083333
0,836956522
0,849462366
0,861702128
0,872340426
0,891304348
0,911111111
0,877777778
0,811111111
0,704081633
0,66
0,683673469
0,741935484
0,777777778
0,788888889
0,791208791
0,78021978
0,758241758
0,760869565
0,772727273
0,771084337
0,797619048
0,814814815
0,831168831
0,797468354
0,784810127
0,8125
0,860759494
0,894736842
0,901408451
0,897058824
0,892307692
0,884057971
0,87804878
0,83908046
0,831325301
0,772151899
0,773333333
0,794871795
0,855421687
0,916666667
0,963414634
1
1,027777778
1,02739726


Summary of computational transaction
Raw Inputview raw input (R code)
Raw Outputview raw output of R engine
Computing time2 seconds
R Server'RServer@AstonUniversity' @ vre.aston.ac.uk

\begin{tabular}{lllllllll}
\hline
Summary of computational transaction \tabularnewline
Raw Input & view raw input (R code)  \tabularnewline
Raw Output & view raw output of R engine  \tabularnewline
Computing time & 2 seconds \tabularnewline
R Server & 'RServer@AstonUniversity' @ vre.aston.ac.uk \tabularnewline
\hline
\end{tabular}
%Source: https://freestatistics.org/blog/index.php?pk=48978&T=0

[TABLE]
[ROW][C]Summary of computational transaction[/C][/ROW]
[ROW][C]Raw Input[/C][C]view raw input (R code) [/C][/ROW]
[ROW][C]Raw Output[/C][C]view raw output of R engine [/C][/ROW]
[ROW][C]Computing time[/C][C]2 seconds[/C][/ROW]
[ROW][C]R Server[/C][C]'RServer@AstonUniversity' @ vre.aston.ac.uk[/C][/ROW]
[/TABLE]
Source: https://freestatistics.org/blog/index.php?pk=48978&T=0

Globally Unique Identifier (entire table): ba.freestatistics.org/blog/index.php?pk=48978&T=0

As an alternative you can also use a QR Code:  

The GUIDs for individual cells are displayed in the table below:

Summary of computational transaction
Raw Inputview raw input (R code)
Raw Outputview raw output of R engine
Computing time2 seconds
R Server'RServer@AstonUniversity' @ vre.aston.ac.uk


Central Tendency - Ungrouped Data
MeasureValueS.E.Value/S.E.
Arithmetic Mean0.8236527429178080.0083098785089878999.117302620845
Geometric Mean0.820702152032003
Harmonic Mean0.81780695978677
Quadratic Mean0.826665430955043
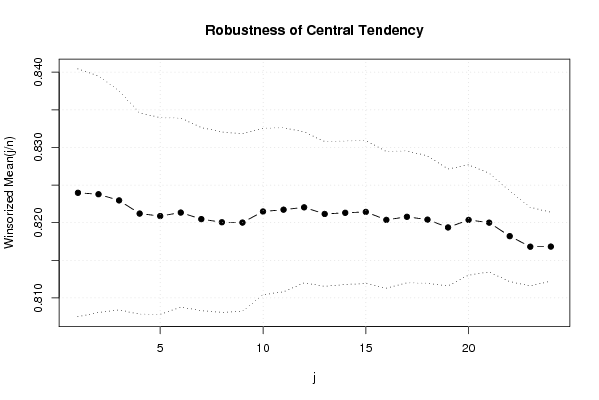
Winsorized Mean ( 1 / 24 )0.8239718244383560.00822529962801727100.175295940797
Winsorized Mean ( 2 / 24 )0.8237803423561640.00785357575374289104.892391464304
Winsorized Mean ( 3 / 24 )0.822960632301370.00727722884562075113.087089846928
Winsorized Mean ( 4 / 24 )0.8212110771232880.0066756750681226123.015435703978
Winsorized Mean ( 5 / 24 )0.8208843596575340.0065355937185284125.602109771654
Winsorized Mean ( 6 / 24 )0.8213455128356170.00627505648649772130.890536938263
Winsorized Mean ( 7 / 24 )0.8204763729863010.00608578097325832134.818583940430
Winsorized Mean ( 8 / 24 )0.8200594285479450.00598854795079840136.937941431798
Winsorized Mean ( 9 / 24 )0.8200171151095890.00589448264749585139.116045317049
Winsorized Mean ( 10 / 24 )0.8214848642876710.00553328508188082148.462414665329
Winsorized Mean ( 11 / 24 )0.8217296463835620.00544425508018644150.935184755418
Winsorized Mean ( 12 / 24 )0.8220393545479450.00501092101945965164.049553236940
Winsorized Mean ( 13 / 24 )0.8211623257534250.00480293439985485170.970964287632
Winsorized Mean ( 14 / 24 )0.8213150906849310.00476488800020644172.368183816566
Winsorized Mean ( 15 / 24 )0.8214333182191780.00474799447803294173.006376064593
Winsorized Mean ( 16 / 24 )0.820374404904110.0045358618824479180.864062038276
Winsorized Mean ( 17 / 24 )0.820785332397260.00438104142472611187.349365784318
Winsorized Mean ( 18 / 24 )0.8204083966164380.00422533379828138194.164162119010
Winsorized Mean ( 19 / 24 )0.819370492205480.0038779326745208211.290540856728
Winsorized Mean ( 20 / 24 )0.8203698656301370.00366560731814208223.801895410320
Winsorized Mean ( 21 / 24 )0.820007674602740.00327618716298701250.293293334045
Winsorized Mean ( 22 / 24 )0.8182117148493150.00301173149448443271.674854264982
Winsorized Mean ( 23 / 24 )0.8168109723150680.00261176797898301312.742547916957
Winsorized Mean ( 24 / 24 )0.8168263701232880.00228713860284457357.13898978723
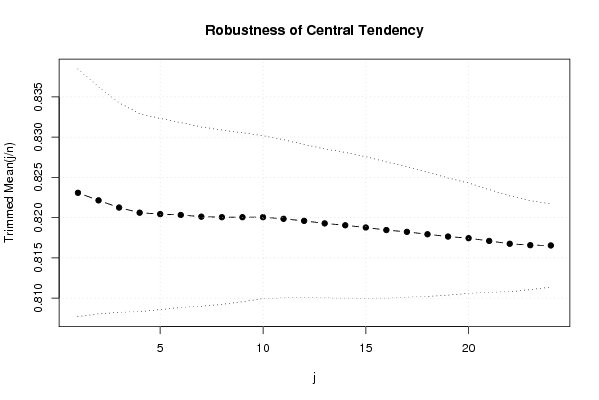
Trimmed Mean ( 1 / 24 )0.8230827106338030.00769744696418569106.929312337377
Trimmed Mean ( 2 / 24 )0.8221420540.00705047419994018116.608050846704
Trimmed Mean ( 3 / 24 )0.8212495536268660.00651357038557073126.082855486777
Trimmed Mean ( 4 / 24 )0.8206089959692310.00614853787411064133.464087360433
Trimmed Mean ( 5 / 24 )0.8204345835714290.0059442931023747138.020546672517
Trimmed Mean ( 6 / 24 )0.8203269322459020.0057430364432034142.838538525507
Trimmed Mean ( 7 / 24 )0.8201168859661020.00557417025810062147.128065342869
Trimmed Mean ( 8 / 24 )0.8200511151578950.00541813121607276151.353129419463
Trimmed Mean ( 9 / 24 )0.820049735890910.00524985556610916156.204247062491
Trimmed Mean ( 10 / 24 )0.8200547281698110.00506346510212991161.955244408589
Trimmed Mean ( 11 / 24 )0.8198500224117650.0049156304402528166.784308213699
Trimmed Mean ( 12 / 24 )0.819595453673470.00474830515929861172.607999312861
Trimmed Mean ( 13 / 24 )0.8192791331702130.00463313236385911176.830504468429
Trimmed Mean ( 14 / 24 )0.8190441364888890.00452993491669799180.807042827431
Trimmed Mean ( 15 / 24 )0.8187687550.00440089786260374186.045843498759
Trimmed Mean ( 16 / 24 )0.8184524735121950.00423202416204785193.395037970707
Trimmed Mean ( 17 / 24 )0.8182276321794870.0040601771381053201.525106996025
Trimmed Mean ( 18 / 24 )0.8179307925675680.00386545460642487211.600154664361
Trimmed Mean ( 19 / 24 )0.8176437051142860.00364000871975235224.626853413119
Trimmed Mean ( 20 / 24 )0.8174426597272730.00343004645196437238.318247631640
Trimmed Mean ( 21 / 24 )0.817098004838710.00319259192698207255.935623320048
Trimmed Mean ( 22 / 24 )0.8167492266896550.00298005926496864274.071471091448
Trimmed Mean ( 23 / 24 )0.8165694932962960.00276422802282160295.405981906941
Trimmed Mean ( 24 / 24 )0.816538835960.0025942679021203314.747307050533
Median0.815217391
Midrange0.843888889
Midmean - Weighted Average at Xnp0.81653631825
Midmean - Weighted Average at X(n+1)p0.817930792567568
Midmean - Empirical Distribution Function0.817930792567568
Midmean - Empirical Distribution Function - Averaging0.817930792567568
Midmean - Empirical Distribution Function - Interpolation0.817930792567568
Midmean - Closest Observation0.816839734552632
Midmean - True Basic - Statistics Graphics Toolkit0.817930792567568
Midmean - MS Excel (old versions)0.817930792567568
Number of observations73

\begin{tabular}{lllllllll}
\hline
Central Tendency - Ungrouped Data \tabularnewline
Measure & Value & S.E. & Value/S.E. \tabularnewline
Arithmetic Mean & 0.823652742917808 & 0.00830987850898789 & 99.117302620845 \tabularnewline
Geometric Mean & 0.820702152032003 &  &  \tabularnewline
Harmonic Mean & 0.81780695978677 &  &  \tabularnewline
Quadratic Mean & 0.826665430955043 &  &  \tabularnewline
Winsorized Mean ( 1 / 24 ) & 0.823971824438356 & 0.00822529962801727 & 100.175295940797 \tabularnewline
Winsorized Mean ( 2 / 24 ) & 0.823780342356164 & 0.00785357575374289 & 104.892391464304 \tabularnewline
Winsorized Mean ( 3 / 24 ) & 0.82296063230137 & 0.00727722884562075 & 113.087089846928 \tabularnewline
Winsorized Mean ( 4 / 24 ) & 0.821211077123288 & 0.0066756750681226 & 123.015435703978 \tabularnewline
Winsorized Mean ( 5 / 24 ) & 0.820884359657534 & 0.0065355937185284 & 125.602109771654 \tabularnewline
Winsorized Mean ( 6 / 24 ) & 0.821345512835617 & 0.00627505648649772 & 130.890536938263 \tabularnewline
Winsorized Mean ( 7 / 24 ) & 0.820476372986301 & 0.00608578097325832 & 134.818583940430 \tabularnewline
Winsorized Mean ( 8 / 24 ) & 0.820059428547945 & 0.00598854795079840 & 136.937941431798 \tabularnewline
Winsorized Mean ( 9 / 24 ) & 0.820017115109589 & 0.00589448264749585 & 139.116045317049 \tabularnewline
Winsorized Mean ( 10 / 24 ) & 0.821484864287671 & 0.00553328508188082 & 148.462414665329 \tabularnewline
Winsorized Mean ( 11 / 24 ) & 0.821729646383562 & 0.00544425508018644 & 150.935184755418 \tabularnewline
Winsorized Mean ( 12 / 24 ) & 0.822039354547945 & 0.00501092101945965 & 164.049553236940 \tabularnewline
Winsorized Mean ( 13 / 24 ) & 0.821162325753425 & 0.00480293439985485 & 170.970964287632 \tabularnewline
Winsorized Mean ( 14 / 24 ) & 0.821315090684931 & 0.00476488800020644 & 172.368183816566 \tabularnewline
Winsorized Mean ( 15 / 24 ) & 0.821433318219178 & 0.00474799447803294 & 173.006376064593 \tabularnewline
Winsorized Mean ( 16 / 24 ) & 0.82037440490411 & 0.0045358618824479 & 180.864062038276 \tabularnewline
Winsorized Mean ( 17 / 24 ) & 0.82078533239726 & 0.00438104142472611 & 187.349365784318 \tabularnewline
Winsorized Mean ( 18 / 24 ) & 0.820408396616438 & 0.00422533379828138 & 194.164162119010 \tabularnewline
Winsorized Mean ( 19 / 24 ) & 0.81937049220548 & 0.0038779326745208 & 211.290540856728 \tabularnewline
Winsorized Mean ( 20 / 24 ) & 0.820369865630137 & 0.00366560731814208 & 223.801895410320 \tabularnewline
Winsorized Mean ( 21 / 24 ) & 0.82000767460274 & 0.00327618716298701 & 250.293293334045 \tabularnewline
Winsorized Mean ( 22 / 24 ) & 0.818211714849315 & 0.00301173149448443 & 271.674854264982 \tabularnewline
Winsorized Mean ( 23 / 24 ) & 0.816810972315068 & 0.00261176797898301 & 312.742547916957 \tabularnewline
Winsorized Mean ( 24 / 24 ) & 0.816826370123288 & 0.00228713860284457 & 357.13898978723 \tabularnewline
Trimmed Mean ( 1 / 24 ) & 0.823082710633803 & 0.00769744696418569 & 106.929312337377 \tabularnewline
Trimmed Mean ( 2 / 24 ) & 0.822142054 & 0.00705047419994018 & 116.608050846704 \tabularnewline
Trimmed Mean ( 3 / 24 ) & 0.821249553626866 & 0.00651357038557073 & 126.082855486777 \tabularnewline
Trimmed Mean ( 4 / 24 ) & 0.820608995969231 & 0.00614853787411064 & 133.464087360433 \tabularnewline
Trimmed Mean ( 5 / 24 ) & 0.820434583571429 & 0.0059442931023747 & 138.020546672517 \tabularnewline
Trimmed Mean ( 6 / 24 ) & 0.820326932245902 & 0.0057430364432034 & 142.838538525507 \tabularnewline
Trimmed Mean ( 7 / 24 ) & 0.820116885966102 & 0.00557417025810062 & 147.128065342869 \tabularnewline
Trimmed Mean ( 8 / 24 ) & 0.820051115157895 & 0.00541813121607276 & 151.353129419463 \tabularnewline
Trimmed Mean ( 9 / 24 ) & 0.82004973589091 & 0.00524985556610916 & 156.204247062491 \tabularnewline
Trimmed Mean ( 10 / 24 ) & 0.820054728169811 & 0.00506346510212991 & 161.955244408589 \tabularnewline
Trimmed Mean ( 11 / 24 ) & 0.819850022411765 & 0.0049156304402528 & 166.784308213699 \tabularnewline
Trimmed Mean ( 12 / 24 ) & 0.81959545367347 & 0.00474830515929861 & 172.607999312861 \tabularnewline
Trimmed Mean ( 13 / 24 ) & 0.819279133170213 & 0.00463313236385911 & 176.830504468429 \tabularnewline
Trimmed Mean ( 14 / 24 ) & 0.819044136488889 & 0.00452993491669799 & 180.807042827431 \tabularnewline
Trimmed Mean ( 15 / 24 ) & 0.818768755 & 0.00440089786260374 & 186.045843498759 \tabularnewline
Trimmed Mean ( 16 / 24 ) & 0.818452473512195 & 0.00423202416204785 & 193.395037970707 \tabularnewline
Trimmed Mean ( 17 / 24 ) & 0.818227632179487 & 0.0040601771381053 & 201.525106996025 \tabularnewline
Trimmed Mean ( 18 / 24 ) & 0.817930792567568 & 0.00386545460642487 & 211.600154664361 \tabularnewline
Trimmed Mean ( 19 / 24 ) & 0.817643705114286 & 0.00364000871975235 & 224.626853413119 \tabularnewline
Trimmed Mean ( 20 / 24 ) & 0.817442659727273 & 0.00343004645196437 & 238.318247631640 \tabularnewline
Trimmed Mean ( 21 / 24 ) & 0.81709800483871 & 0.00319259192698207 & 255.935623320048 \tabularnewline
Trimmed Mean ( 22 / 24 ) & 0.816749226689655 & 0.00298005926496864 & 274.071471091448 \tabularnewline
Trimmed Mean ( 23 / 24 ) & 0.816569493296296 & 0.00276422802282160 & 295.405981906941 \tabularnewline
Trimmed Mean ( 24 / 24 ) & 0.81653883596 & 0.0025942679021203 & 314.747307050533 \tabularnewline
Median & 0.815217391 &  &  \tabularnewline
Midrange & 0.843888889 &  &  \tabularnewline
Midmean - Weighted Average at Xnp & 0.81653631825 &  &  \tabularnewline
Midmean - Weighted Average at X(n+1)p & 0.817930792567568 &  &  \tabularnewline
Midmean - Empirical Distribution Function & 0.817930792567568 &  &  \tabularnewline
Midmean - Empirical Distribution Function - Averaging & 0.817930792567568 &  &  \tabularnewline
Midmean - Empirical Distribution Function - Interpolation & 0.817930792567568 &  &  \tabularnewline
Midmean - Closest Observation & 0.816839734552632 &  &  \tabularnewline
Midmean - True Basic - Statistics Graphics Toolkit & 0.817930792567568 &  &  \tabularnewline
Midmean - MS Excel (old versions) & 0.817930792567568 &  &  \tabularnewline
Number of observations & 73 &  &  \tabularnewline
\hline
\end{tabular}
%Source: https://freestatistics.org/blog/index.php?pk=48978&T=1

[TABLE]
[ROW][C]Central Tendency - Ungrouped Data[/C][/ROW]
[ROW][C]Measure[/C][C]Value[/C][C]S.E.[/C][C]Value/S.E.[/C][/ROW]
[ROW][C]Arithmetic Mean[/C][C]0.823652742917808[/C][C]0.00830987850898789[/C][C]99.117302620845[/C][/ROW]
[ROW][C]Geometric Mean[/C][C]0.820702152032003[/C][C][/C][C][/C][/ROW]
[ROW][C]Harmonic Mean[/C][C]0.81780695978677[/C][C][/C][C][/C][/ROW]
[ROW][C]Quadratic Mean[/C][C]0.826665430955043[/C][C][/C][C][/C][/ROW]
[ROW][C]Winsorized Mean ( 1 / 24 )[/C][C]0.823971824438356[/C][C]0.00822529962801727[/C][C]100.175295940797[/C][/ROW]
[ROW][C]Winsorized Mean ( 2 / 24 )[/C][C]0.823780342356164[/C][C]0.00785357575374289[/C][C]104.892391464304[/C][/ROW]
[ROW][C]Winsorized Mean ( 3 / 24 )[/C][C]0.82296063230137[/C][C]0.00727722884562075[/C][C]113.087089846928[/C][/ROW]
[ROW][C]Winsorized Mean ( 4 / 24 )[/C][C]0.821211077123288[/C][C]0.0066756750681226[/C][C]123.015435703978[/C][/ROW]
[ROW][C]Winsorized Mean ( 5 / 24 )[/C][C]0.820884359657534[/C][C]0.0065355937185284[/C][C]125.602109771654[/C][/ROW]
[ROW][C]Winsorized Mean ( 6 / 24 )[/C][C]0.821345512835617[/C][C]0.00627505648649772[/C][C]130.890536938263[/C][/ROW]
[ROW][C]Winsorized Mean ( 7 / 24 )[/C][C]0.820476372986301[/C][C]0.00608578097325832[/C][C]134.818583940430[/C][/ROW]
[ROW][C]Winsorized Mean ( 8 / 24 )[/C][C]0.820059428547945[/C][C]0.00598854795079840[/C][C]136.937941431798[/C][/ROW]
[ROW][C]Winsorized Mean ( 9 / 24 )[/C][C]0.820017115109589[/C][C]0.00589448264749585[/C][C]139.116045317049[/C][/ROW]
[ROW][C]Winsorized Mean ( 10 / 24 )[/C][C]0.821484864287671[/C][C]0.00553328508188082[/C][C]148.462414665329[/C][/ROW]
[ROW][C]Winsorized Mean ( 11 / 24 )[/C][C]0.821729646383562[/C][C]0.00544425508018644[/C][C]150.935184755418[/C][/ROW]
[ROW][C]Winsorized Mean ( 12 / 24 )[/C][C]0.822039354547945[/C][C]0.00501092101945965[/C][C]164.049553236940[/C][/ROW]
[ROW][C]Winsorized Mean ( 13 / 24 )[/C][C]0.821162325753425[/C][C]0.00480293439985485[/C][C]170.970964287632[/C][/ROW]
[ROW][C]Winsorized Mean ( 14 / 24 )[/C][C]0.821315090684931[/C][C]0.00476488800020644[/C][C]172.368183816566[/C][/ROW]
[ROW][C]Winsorized Mean ( 15 / 24 )[/C][C]0.821433318219178[/C][C]0.00474799447803294[/C][C]173.006376064593[/C][/ROW]
[ROW][C]Winsorized Mean ( 16 / 24 )[/C][C]0.82037440490411[/C][C]0.0045358618824479[/C][C]180.864062038276[/C][/ROW]
[ROW][C]Winsorized Mean ( 17 / 24 )[/C][C]0.82078533239726[/C][C]0.00438104142472611[/C][C]187.349365784318[/C][/ROW]
[ROW][C]Winsorized Mean ( 18 / 24 )[/C][C]0.820408396616438[/C][C]0.00422533379828138[/C][C]194.164162119010[/C][/ROW]
[ROW][C]Winsorized Mean ( 19 / 24 )[/C][C]0.81937049220548[/C][C]0.0038779326745208[/C][C]211.290540856728[/C][/ROW]
[ROW][C]Winsorized Mean ( 20 / 24 )[/C][C]0.820369865630137[/C][C]0.00366560731814208[/C][C]223.801895410320[/C][/ROW]
[ROW][C]Winsorized Mean ( 21 / 24 )[/C][C]0.82000767460274[/C][C]0.00327618716298701[/C][C]250.293293334045[/C][/ROW]
[ROW][C]Winsorized Mean ( 22 / 24 )[/C][C]0.818211714849315[/C][C]0.00301173149448443[/C][C]271.674854264982[/C][/ROW]
[ROW][C]Winsorized Mean ( 23 / 24 )[/C][C]0.816810972315068[/C][C]0.00261176797898301[/C][C]312.742547916957[/C][/ROW]
[ROW][C]Winsorized Mean ( 24 / 24 )[/C][C]0.816826370123288[/C][C]0.00228713860284457[/C][C]357.13898978723[/C][/ROW]
[ROW][C]Trimmed Mean ( 1 / 24 )[/C][C]0.823082710633803[/C][C]0.00769744696418569[/C][C]106.929312337377[/C][/ROW]
[ROW][C]Trimmed Mean ( 2 / 24 )[/C][C]0.822142054[/C][C]0.00705047419994018[/C][C]116.608050846704[/C][/ROW]
[ROW][C]Trimmed Mean ( 3 / 24 )[/C][C]0.821249553626866[/C][C]0.00651357038557073[/C][C]126.082855486777[/C][/ROW]
[ROW][C]Trimmed Mean ( 4 / 24 )[/C][C]0.820608995969231[/C][C]0.00614853787411064[/C][C]133.464087360433[/C][/ROW]
[ROW][C]Trimmed Mean ( 5 / 24 )[/C][C]0.820434583571429[/C][C]0.0059442931023747[/C][C]138.020546672517[/C][/ROW]
[ROW][C]Trimmed Mean ( 6 / 24 )[/C][C]0.820326932245902[/C][C]0.0057430364432034[/C][C]142.838538525507[/C][/ROW]
[ROW][C]Trimmed Mean ( 7 / 24 )[/C][C]0.820116885966102[/C][C]0.00557417025810062[/C][C]147.128065342869[/C][/ROW]
[ROW][C]Trimmed Mean ( 8 / 24 )[/C][C]0.820051115157895[/C][C]0.00541813121607276[/C][C]151.353129419463[/C][/ROW]
[ROW][C]Trimmed Mean ( 9 / 24 )[/C][C]0.82004973589091[/C][C]0.00524985556610916[/C][C]156.204247062491[/C][/ROW]
[ROW][C]Trimmed Mean ( 10 / 24 )[/C][C]0.820054728169811[/C][C]0.00506346510212991[/C][C]161.955244408589[/C][/ROW]
[ROW][C]Trimmed Mean ( 11 / 24 )[/C][C]0.819850022411765[/C][C]0.0049156304402528[/C][C]166.784308213699[/C][/ROW]
[ROW][C]Trimmed Mean ( 12 / 24 )[/C][C]0.81959545367347[/C][C]0.00474830515929861[/C][C]172.607999312861[/C][/ROW]
[ROW][C]Trimmed Mean ( 13 / 24 )[/C][C]0.819279133170213[/C][C]0.00463313236385911[/C][C]176.830504468429[/C][/ROW]
[ROW][C]Trimmed Mean ( 14 / 24 )[/C][C]0.819044136488889[/C][C]0.00452993491669799[/C][C]180.807042827431[/C][/ROW]
[ROW][C]Trimmed Mean ( 15 / 24 )[/C][C]0.818768755[/C][C]0.00440089786260374[/C][C]186.045843498759[/C][/ROW]
[ROW][C]Trimmed Mean ( 16 / 24 )[/C][C]0.818452473512195[/C][C]0.00423202416204785[/C][C]193.395037970707[/C][/ROW]
[ROW][C]Trimmed Mean ( 17 / 24 )[/C][C]0.818227632179487[/C][C]0.0040601771381053[/C][C]201.525106996025[/C][/ROW]
[ROW][C]Trimmed Mean ( 18 / 24 )[/C][C]0.817930792567568[/C][C]0.00386545460642487[/C][C]211.600154664361[/C][/ROW]
[ROW][C]Trimmed Mean ( 19 / 24 )[/C][C]0.817643705114286[/C][C]0.00364000871975235[/C][C]224.626853413119[/C][/ROW]
[ROW][C]Trimmed Mean ( 20 / 24 )[/C][C]0.817442659727273[/C][C]0.00343004645196437[/C][C]238.318247631640[/C][/ROW]
[ROW][C]Trimmed Mean ( 21 / 24 )[/C][C]0.81709800483871[/C][C]0.00319259192698207[/C][C]255.935623320048[/C][/ROW]
[ROW][C]Trimmed Mean ( 22 / 24 )[/C][C]0.816749226689655[/C][C]0.00298005926496864[/C][C]274.071471091448[/C][/ROW]
[ROW][C]Trimmed Mean ( 23 / 24 )[/C][C]0.816569493296296[/C][C]0.00276422802282160[/C][C]295.405981906941[/C][/ROW]
[ROW][C]Trimmed Mean ( 24 / 24 )[/C][C]0.81653883596[/C][C]0.0025942679021203[/C][C]314.747307050533[/C][/ROW]
[ROW][C]Median[/C][C]0.815217391[/C][C][/C][C][/C][/ROW]
[ROW][C]Midrange[/C][C]0.843888889[/C][C][/C][C][/C][/ROW]
[ROW][C]Midmean - Weighted Average at Xnp[/C][C]0.81653631825[/C][C][/C][C][/C][/ROW]
[ROW][C]Midmean - Weighted Average at X(n+1)p[/C][C]0.817930792567568[/C][C][/C][C][/C][/ROW]
[ROW][C]Midmean - Empirical Distribution Function[/C][C]0.817930792567568[/C][C][/C][C][/C][/ROW]
[ROW][C]Midmean - Empirical Distribution Function - Averaging[/C][C]0.817930792567568[/C][C][/C][C][/C][/ROW]
[ROW][C]Midmean - Empirical Distribution Function - Interpolation[/C][C]0.817930792567568[/C][C][/C][C][/C][/ROW]
[ROW][C]Midmean - Closest Observation[/C][C]0.816839734552632[/C][C][/C][C][/C][/ROW]
[ROW][C]Midmean - True Basic - Statistics Graphics Toolkit[/C][C]0.817930792567568[/C][C][/C][C][/C][/ROW]
[ROW][C]Midmean - MS Excel (old versions)[/C][C]0.817930792567568[/C][C][/C][C][/C][/ROW]
[ROW][C]Number of observations[/C][C]73[/C][C][/C][C][/C][/ROW]
[/TABLE]
Source: https://freestatistics.org/blog/index.php?pk=48978&T=1

Globally Unique Identifier (entire table): ba.freestatistics.org/blog/index.php?pk=48978&T=1

As an alternative you can also use a QR Code:  

The GUIDs for individual cells are displayed in the table below:

Central Tendency - Ungrouped Data
MeasureValueS.E.Value/S.E.
Arithmetic Mean0.8236527429178080.0083098785089878999.117302620845
Geometric Mean0.820702152032003
Harmonic Mean0.81780695978677
Quadratic Mean0.826665430955043
Winsorized Mean ( 1 / 24 )0.8239718244383560.00822529962801727100.175295940797
Winsorized Mean ( 2 / 24 )0.8237803423561640.00785357575374289104.892391464304
Winsorized Mean ( 3 / 24 )0.822960632301370.00727722884562075113.087089846928
Winsorized Mean ( 4 / 24 )0.8212110771232880.0066756750681226123.015435703978
Winsorized Mean ( 5 / 24 )0.8208843596575340.0065355937185284125.602109771654
Winsorized Mean ( 6 / 24 )0.8213455128356170.00627505648649772130.890536938263
Winsorized Mean ( 7 / 24 )0.8204763729863010.00608578097325832134.818583940430
Winsorized Mean ( 8 / 24 )0.8200594285479450.00598854795079840136.937941431798
Winsorized Mean ( 9 / 24 )0.8200171151095890.00589448264749585139.116045317049
Winsorized Mean ( 10 / 24 )0.8214848642876710.00553328508188082148.462414665329
Winsorized Mean ( 11 / 24 )0.8217296463835620.00544425508018644150.935184755418
Winsorized Mean ( 12 / 24 )0.8220393545479450.00501092101945965164.049553236940
Winsorized Mean ( 13 / 24 )0.8211623257534250.00480293439985485170.970964287632
Winsorized Mean ( 14 / 24 )0.8213150906849310.00476488800020644172.368183816566
Winsorized Mean ( 15 / 24 )0.8214333182191780.00474799447803294173.006376064593
Winsorized Mean ( 16 / 24 )0.820374404904110.0045358618824479180.864062038276
Winsorized Mean ( 17 / 24 )0.820785332397260.00438104142472611187.349365784318
Winsorized Mean ( 18 / 24 )0.8204083966164380.00422533379828138194.164162119010
Winsorized Mean ( 19 / 24 )0.819370492205480.0038779326745208211.290540856728
Winsorized Mean ( 20 / 24 )0.8203698656301370.00366560731814208223.801895410320
Winsorized Mean ( 21 / 24 )0.820007674602740.00327618716298701250.293293334045
Winsorized Mean ( 22 / 24 )0.8182117148493150.00301173149448443271.674854264982
Winsorized Mean ( 23 / 24 )0.8168109723150680.00261176797898301312.742547916957
Winsorized Mean ( 24 / 24 )0.8168263701232880.00228713860284457357.13898978723
Trimmed Mean ( 1 / 24 )0.8230827106338030.00769744696418569106.929312337377
Trimmed Mean ( 2 / 24 )0.8221420540.00705047419994018116.608050846704
Trimmed Mean ( 3 / 24 )0.8212495536268660.00651357038557073126.082855486777
Trimmed Mean ( 4 / 24 )0.8206089959692310.00614853787411064133.464087360433
Trimmed Mean ( 5 / 24 )0.8204345835714290.0059442931023747138.020546672517
Trimmed Mean ( 6 / 24 )0.8203269322459020.0057430364432034142.838538525507
Trimmed Mean ( 7 / 24 )0.8201168859661020.00557417025810062147.128065342869
Trimmed Mean ( 8 / 24 )0.8200511151578950.00541813121607276151.353129419463
Trimmed Mean ( 9 / 24 )0.820049735890910.00524985556610916156.204247062491
Trimmed Mean ( 10 / 24 )0.8200547281698110.00506346510212991161.955244408589
Trimmed Mean ( 11 / 24 )0.8198500224117650.0049156304402528166.784308213699
Trimmed Mean ( 12 / 24 )0.819595453673470.00474830515929861172.607999312861
Trimmed Mean ( 13 / 24 )0.8192791331702130.00463313236385911176.830504468429
Trimmed Mean ( 14 / 24 )0.8190441364888890.00452993491669799180.807042827431
Trimmed Mean ( 15 / 24 )0.8187687550.00440089786260374186.045843498759
Trimmed Mean ( 16 / 24 )0.8184524735121950.00423202416204785193.395037970707
Trimmed Mean ( 17 / 24 )0.8182276321794870.0040601771381053201.525106996025
Trimmed Mean ( 18 / 24 )0.8179307925675680.00386545460642487211.600154664361
Trimmed Mean ( 19 / 24 )0.8176437051142860.00364000871975235224.626853413119
Trimmed Mean ( 20 / 24 )0.8174426597272730.00343004645196437238.318247631640
Trimmed Mean ( 21 / 24 )0.817098004838710.00319259192698207255.935623320048
Trimmed Mean ( 22 / 24 )0.8167492266896550.00298005926496864274.071471091448
Trimmed Mean ( 23 / 24 )0.8165694932962960.00276422802282160295.405981906941
Trimmed Mean ( 24 / 24 )0.816538835960.0025942679021203314.747307050533
Median0.815217391
Midrange0.843888889
Midmean - Weighted Average at Xnp0.81653631825
Midmean - Weighted Average at X(n+1)p0.817930792567568
Midmean - Empirical Distribution Function0.817930792567568
Midmean - Empirical Distribution Function - Averaging0.817930792567568
Midmean - Empirical Distribution Function - Interpolation0.817930792567568
Midmean - Closest Observation0.816839734552632
Midmean - True Basic - Statistics Graphics Toolkit0.817930792567568
Midmean - MS Excel (old versions)0.817930792567568
Number of observations73


Parameters (Session):
Parameters (R input):
R code (references can be found in the software module):
geomean <- function(x) {
return(exp(mean(log(x))))
}
harmean <- function(x) {
return(1/mean(1/x))
}
quamean <- function(x) {
return(sqrt(mean(x*x)))
}
winmean <- function(x) {
x <-sort(x[!is.na(x)])
n<-length(x)
denom <- 3
nodenom <- n/denom
if (nodenom>40) denom <- n/40
sqrtn = sqrt(n)
roundnodenom = floor(nodenom)
win <- array(NA,dim=c(roundnodenom,2))
for (j in 1:roundnodenom) {
win[j,1] <- (j*x[j+1]+sum(x[(j+1):(n-j)])+j*x[n-j])/n
win[j,2] <- sd(c(rep(x[j+1],j),x[(j+1):(n-j)],rep(x[n-j],j)))/sqrtn
}
return(win)
}
trimean <- function(x) {
x <-sort(x[!is.na(x)])
n<-length(x)
denom <- 3
nodenom <- n/denom
if (nodenom>40) denom <- n/40
sqrtn = sqrt(n)
roundnodenom = floor(nodenom)
tri <- array(NA,dim=c(roundnodenom,2))
for (j in 1:roundnodenom) {
tri[j,1] <- mean(x,trim=j/n)
tri[j,2] <- sd(x[(j+1):(n-j)]) / sqrt(n-j*2)
}
return(tri)
}
midrange <- function(x) {
return((max(x)+min(x))/2)
}
q1 <- function(data,n,p,i,f) {
np <- n*p;
i <<- floor(np)
f <<- np - i
qvalue <- (1-f)*data[i] + f*data[i+1]
}
q2 <- function(data,n,p,i,f) {
np <- (n+1)*p
i <<- floor(np)
f <<- np - i
qvalue <- (1-f)*data[i] + f*data[i+1]
}
q3 <- function(data,n,p,i,f) {
np <- n*p
i <<- floor(np)
f <<- np - i
if (f==0) {
qvalue <- data[i]
} else {
qvalue <- data[i+1]
}
}
q4 <- function(data,n,p,i,f) {
np <- n*p
i <<- floor(np)
f <<- np - i
if (f==0) {
qvalue <- (data[i]+data[i+1])/2
} else {
qvalue <- data[i+1]
}
}
q5 <- function(data,n,p,i,f) {
np <- (n-1)*p
i <<- floor(np)
f <<- np - i
if (f==0) {
qvalue <- data[i+1]
} else {
qvalue <- data[i+1] + f*(data[i+2]-data[i+1])
}
}
q6 <- function(data,n,p,i,f) {
np <- n*p+0.5
i <<- floor(np)
f <<- np - i
qvalue <- data[i]
}
q7 <- function(data,n,p,i,f) {
np <- (n+1)*p
i <<- floor(np)
f <<- np - i
if (f==0) {
qvalue <- data[i]
} else {
qvalue <- f*data[i] + (1-f)*data[i+1]
}
}
q8 <- function(data,n,p,i,f) {
np <- (n+1)*p
i <<- floor(np)
f <<- np - i
if (f==0) {
qvalue <- data[i]
} else {
if (f == 0.5) {
qvalue <- (data[i]+data[i+1])/2
} else {
if (f < 0.5) {
qvalue <- data[i]
} else {
qvalue <- data[i+1]
}
}
}
}
midmean <- function(x,def) {
x <-sort(x[!is.na(x)])
n<-length(x)
if (def==1) {
qvalue1 <- q1(x,n,0.25,i,f)
qvalue3 <- q1(x,n,0.75,i,f)
}
if (def==2) {
qvalue1 <- q2(x,n,0.25,i,f)
qvalue3 <- q2(x,n,0.75,i,f)
}
if (def==3) {
qvalue1 <- q3(x,n,0.25,i,f)
qvalue3 <- q3(x,n,0.75,i,f)
}
if (def==4) {
qvalue1 <- q4(x,n,0.25,i,f)
qvalue3 <- q4(x,n,0.75,i,f)
}
if (def==5) {
qvalue1 <- q5(x,n,0.25,i,f)
qvalue3 <- q5(x,n,0.75,i,f)
}
if (def==6) {
qvalue1 <- q6(x,n,0.25,i,f)
qvalue3 <- q6(x,n,0.75,i,f)
}
if (def==7) {
qvalue1 <- q7(x,n,0.25,i,f)
qvalue3 <- q7(x,n,0.75,i,f)
}
if (def==8) {
qvalue1 <- q8(x,n,0.25,i,f)
qvalue3 <- q8(x,n,0.75,i,f)
}
midm <- 0
myn <- 0
roundno4 <- round(n/4)
round3no4 <- round(3*n/4)
for (i in 1:n) {
if ((x[i]>=qvalue1) & (x[i]<=qvalue3)){
midm = midm + x[i]
myn = myn + 1
}
}
midm = midm / myn
return(midm)
}
(arm <- mean(x))
sqrtn <- sqrt(length(x))
(armse <- sd(x) / sqrtn)
(armose <- arm / armse)
(geo <- geomean(x))
(har <- harmean(x))
(qua <- quamean(x))
(win <- winmean(x))
(tri <- trimean(x))
(midr <- midrange(x))
midm <- array(NA,dim=8)
for (j in 1:8) midm[j] <- midmean(x,j)
midm
bitmap(file='test1.png')
lb <- win[,1] - 2*win[,2]
ub <- win[,1] + 2*win[,2]
if ((ylimmin == '') | (ylimmax == '')) plot(win[,1],type='b',main=main, xlab='j', pch=19, ylab='Winsorized Mean(j/n)', ylim=c(min(lb),max(ub))) else plot(win[,1],type='l',main=main, xlab='j', pch=19, ylab='Winsorized Mean(j/n)', ylim=c(ylimmin,ylimmax))
lines(ub,lty=3)
lines(lb,lty=3)
grid()
dev.off()
bitmap(file='test2.png')
lb <- tri[,1] - 2*tri[,2]
ub <- tri[,1] + 2*tri[,2]
if ((ylimmin == '') | (ylimmax == '')) plot(tri[,1],type='b',main=main, xlab='j', pch=19, ylab='Trimmed Mean(j/n)', ylim=c(min(lb),max(ub))) else plot(tri[,1],type='l',main=main, xlab='j', pch=19, ylab='Trimmed Mean(j/n)', ylim=c(ylimmin,ylimmax))
lines(ub,lty=3)
lines(lb,lty=3)
grid()
dev.off()
load(file='createtable')
a<-table.start()
a<-table.row.start(a)
a<-table.element(a,'Central Tendency - Ungrouped Data',4,TRUE)
a<-table.row.end(a)
a<-table.row.start(a)
a<-table.element(a,'Measure',header=TRUE)
a<-table.element(a,'Value',header=TRUE)
a<-table.element(a,'S.E.',header=TRUE)
a<-table.element(a,'Value/S.E.',header=TRUE)
a<-table.row.end(a)
a<-table.row.start(a)
a<-table.element(a,hyperlink('arithmetic_mean.htm', 'Arithmetic Mean', 'click to view the definition of the Arithmetic Mean'),header=TRUE)
a<-table.element(a,arm)
a<-table.element(a,hyperlink('arithmetic_mean_standard_error.htm', armse, 'click to view the definition of the Standard Error of the Arithmetic Mean'))
a<-table.element(a,armose)
a<-table.row.end(a)
a<-table.row.start(a)
a<-table.element(a,hyperlink('geometric_mean.htm', 'Geometric Mean', 'click to view the definition of the Geometric Mean'),header=TRUE)
a<-table.element(a,geo)
a<-table.element(a,'')
a<-table.row.end(a)
a<-table.row.start(a)
a<-table.element(a,hyperlink('harmonic_mean.htm', 'Harmonic Mean', 'click to view the definition of the Harmonic Mean'),header=TRUE)
a<-table.element(a,har)
a<-table.element(a,'')
a<-table.row.end(a)
a<-table.row.start(a)
a<-table.element(a,hyperlink('quadratic_mean.htm', 'Quadratic Mean', 'click to view the definition of the Quadratic Mean'),header=TRUE)
a<-table.element(a,qua)
a<-table.element(a,'')
a<-table.row.end(a)
for (j in 1:length(win[,1])) {
a<-table.row.start(a)
mylabel <- paste('Winsorized Mean (',j)
mylabel <- paste(mylabel,'/')
mylabel <- paste(mylabel,length(win[,1]))
mylabel <- paste(mylabel,')')
a<-table.element(a,hyperlink('winsorized_mean.htm', mylabel, 'click to view the definition of the Winsorized Mean'),header=TRUE)
a<-table.element(a,win[j,1])
a<-table.element(a,win[j,2])
a<-table.element(a,win[j,1]/win[j,2])
a<-table.row.end(a)
}
for (j in 1:length(tri[,1])) {
a<-table.row.start(a)
mylabel <- paste('Trimmed Mean (',j)
mylabel <- paste(mylabel,'/')
mylabel <- paste(mylabel,length(tri[,1]))
mylabel <- paste(mylabel,')')
a<-table.element(a,hyperlink('arithmetic_mean.htm', mylabel, 'click to view the definition of the Trimmed Mean'),header=TRUE)
a<-table.element(a,tri[j,1])
a<-table.element(a,tri[j,2])
a<-table.element(a,tri[j,1]/tri[j,2])
a<-table.row.end(a)
}
a<-table.row.start(a)
a<-table.element(a,hyperlink('median_1.htm', 'Median', 'click to view the definition of the Median'),header=TRUE)
a<-table.element(a,median(x))
a<-table.element(a,'')
a<-table.row.end(a)
a<-table.row.start(a)
a<-table.element(a,hyperlink('midrange.htm', 'Midrange', 'click to view the definition of the Midrange'),header=TRUE)
a<-table.element(a,midr)
a<-table.element(a,'')
a<-table.row.end(a)
a<-table.row.start(a)
mymid <- hyperlink('midmean.htm', 'Midmean', 'click to view the definition of the Midmean')
mylabel <- paste(mymid,hyperlink('method_1.htm','Weighted Average at Xnp',''),sep=' - ')
a<-table.element(a,mylabel,header=TRUE)
a<-table.element(a,midm[1])
a<-table.element(a,'')
a<-table.row.end(a)
a<-table.row.start(a)
mymid <- hyperlink('midmean.htm', 'Midmean', 'click to view the definition of the Midmean')
mylabel <- paste(mymid,hyperlink('method_2.htm','Weighted Average at X(n+1)p',''),sep=' - ')
a<-table.element(a,mylabel,header=TRUE)
a<-table.element(a,midm[2])
a<-table.element(a,'')
a<-table.row.end(a)
a<-table.row.start(a)
mymid <- hyperlink('midmean.htm', 'Midmean', 'click to view the definition of the Midmean')
mylabel <- paste(mymid,hyperlink('method_3.htm','Empirical Distribution Function',''),sep=' - ')
a<-table.element(a,mylabel,header=TRUE)
a<-table.element(a,midm[3])
a<-table.element(a,'')
a<-table.row.end(a)
a<-table.row.start(a)
mymid <- hyperlink('midmean.htm', 'Midmean', 'click to view the definition of the Midmean')
mylabel <- paste(mymid,hyperlink('method_4.htm','Empirical Distribution Function - Averaging',''),sep=' - ')
a<-table.element(a,mylabel,header=TRUE)
a<-table.element(a,midm[4])
a<-table.element(a,'')
a<-table.row.end(a)
a<-table.row.start(a)
mymid <- hyperlink('midmean.htm', 'Midmean', 'click to view the definition of the Midmean')
mylabel <- paste(mymid,hyperlink('method_5.htm','Empirical Distribution Function - Interpolation',''),sep=' - ')
a<-table.element(a,mylabel,header=TRUE)
a<-table.element(a,midm[5])
a<-table.element(a,'')
a<-table.row.end(a)
a<-table.row.start(a)
mymid <- hyperlink('midmean.htm', 'Midmean', 'click to view the definition of the Midmean')
mylabel <- paste(mymid,hyperlink('method_6.htm','Closest Observation',''),sep=' - ')
a<-table.element(a,mylabel,header=TRUE)
a<-table.element(a,midm[6])
a<-table.element(a,'')
a<-table.row.end(a)
a<-table.row.start(a)
mymid <- hyperlink('midmean.htm', 'Midmean', 'click to view the definition of the Midmean')
mylabel <- paste(mymid,hyperlink('method_7.htm','True Basic - Statistics Graphics Toolkit',''),sep=' - ')
a<-table.element(a,mylabel,header=TRUE)
a<-table.element(a,midm[7])
a<-table.element(a,'')
a<-table.row.end(a)
a<-table.row.start(a)
mymid <- hyperlink('midmean.htm', 'Midmean', 'click to view the definition of the Midmean')
mylabel <- paste(mymid,hyperlink('method_8.htm','MS Excel (old versions)',''),sep=' - ')
a<-table.element(a,mylabel,header=TRUE)
a<-table.element(a,midm[8])
a<-table.element(a,'')
a<-table.row.end(a)
a<-table.row.start(a)
a<-table.element(a,'Number of observations',header=TRUE)
a<-table.element(a,length(x))
a<-table.element(a,'')
a<-table.row.end(a)
a<-table.end(a)
table.save(a,file='mytable.tab')