Free Statistics
of Irreproducible Research!
Description of Statistical Computation | |||||||||||||||||||||||||||||||||
|---|---|---|---|---|---|---|---|---|---|---|---|---|---|---|---|---|---|---|---|---|---|---|---|---|---|---|---|---|---|---|---|---|---|
| Author's title | |||||||||||||||||||||||||||||||||
| Author | *The author of this computation has been verified* | ||||||||||||||||||||||||||||||||
| R Software Module | rwasp_density.wasp | ||||||||||||||||||||||||||||||||
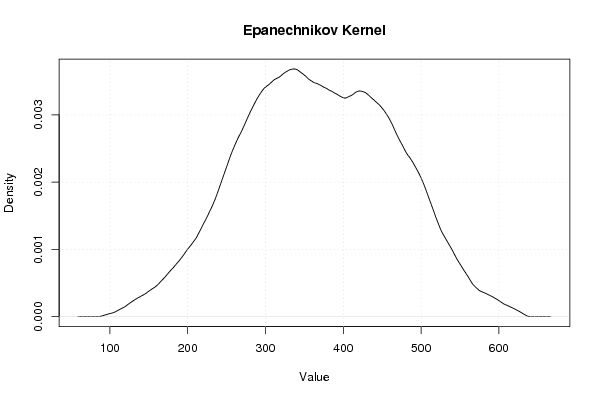
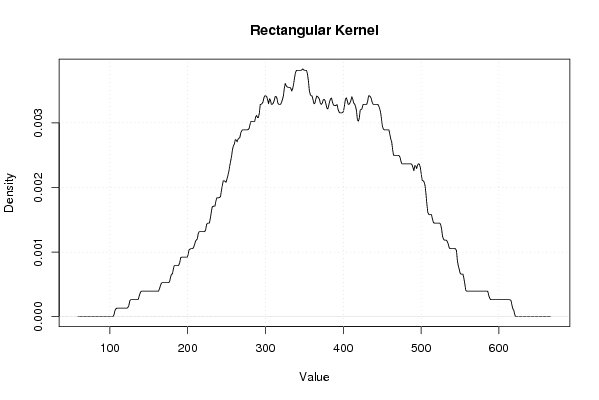
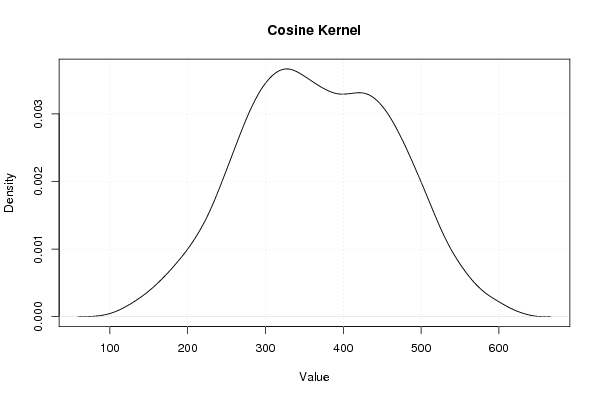
| Title produced by software | Kernel Density Estimation | ||||||||||||||||||||||||||||||||
| Date of computation | Sun, 18 Oct 2009 13:39:18 -0600 | ||||||||||||||||||||||||||||||||
| Cite this page as follows | Statistical Computations at FreeStatistics.org, Office for Research Development and Education, URL https://freestatistics.org/blog/index.php?v=date/2009/Oct/18/t12558948526tzl3vzb5xy0o6t.htm/, Retrieved Mon, 29 Apr 2024 10:16:31 +0000 | ||||||||||||||||||||||||||||||||
| Statistical Computations at FreeStatistics.org, Office for Research Development and Education, URL https://freestatistics.org/blog/index.php?pk=47479, Retrieved Mon, 29 Apr 2024 10:16:31 +0000 | |||||||||||||||||||||||||||||||||
| QR Codes: | |||||||||||||||||||||||||||||||||
|
| |||||||||||||||||||||||||||||||||
| Original text written by user: | |||||||||||||||||||||||||||||||||
| IsPrivate? | No (this computation is public) | ||||||||||||||||||||||||||||||||
| User-defined keywords | ShwWs3V2 | ||||||||||||||||||||||||||||||||
| Estimated Impact | 165 | ||||||||||||||||||||||||||||||||
Tree of Dependent Computations | |||||||||||||||||||||||||||||||||
| Family? (F = Feedback message, R = changed R code, M = changed R Module, P = changed Parameters, D = changed Data) | |||||||||||||||||||||||||||||||||
| - [Bivariate Data Series] [Bivariate dataset] [2008-01-05 23:51:08] [74be16979710d4c4e7c6647856088456] F RMPD [Univariate Explorative Data Analysis] [Colombia Coffee] [2008-01-07 14:21:11] [74be16979710d4c4e7c6647856088456] F RMPD [Univariate Data Series] [] [2009-10-14 08:30:28] [74be16979710d4c4e7c6647856088456] - RMP [Kernel Density Estimation] [WS3 part 1 kernal...] [2009-10-18 14:43:08] [e0fc65a5811681d807296d590d5b45de] - D [Kernel Density Estimation] [WS3 Part 2 Yt] [2009-10-18 18:13:13] [e0fc65a5811681d807296d590d5b45de] - D [Kernel Density Estimation] [WS3Part2Yt-Xt] [2009-10-18 19:03:19] [e0fc65a5811681d807296d590d5b45de] - D [Kernel Density Estimation] [WS3Part2Yt/Xt] [2009-10-18 19:39:18] [51108381f3361ca8af49c4f74052c840] [Current] - D [Kernel Density Estimation] [Ws3Part2Yt*Xt] [2009-10-19 19:46:46] [e0fc65a5811681d807296d590d5b45de] | |||||||||||||||||||||||||||||||||
| Feedback Forum | |||||||||||||||||||||||||||||||||
Post a new message | |||||||||||||||||||||||||||||||||
Dataset | |||||||||||||||||||||||||||||||||
| Dataseries X: | |||||||||||||||||||||||||||||||||
557,1102662 445,4847909 486,5340909 437,8314394 444,5009416 426,9238006 387,4718045 316,1365762 291,9309701 397,250699 313,3737185 200,5400372 524,6025105 492,7412626 494,0112577 483,557852 384,1178651 354,2627048 326,4841872 243,8965836 293,7868189 349,990797 252,5128393 168,6416583 463,688893 400,7759722 442,5694761 399,6995356 342,2891017 367,4831543 322,7739882 263,5942608 313,0730822 386,5517241 275,5341395 240,1579808 430,9061195 452,1613573 553,8884383 484,0616272 359,7648774 399,7359075 286,1388838 271,3378109 307,0683241 354,829932 305,3823849 227,0744729 464,9493854 410,9418657 472,3691311 436,7658962 373,7577223 443,912265 292,8284003 298,6400644 319,028014 330,6311936 318,979081 187,1831489 | |||||||||||||||||||||||||||||||||
Tables (Output of Computation) | |||||||||||||||||||||||||||||||||
| |||||||||||||||||||||||||||||||||
Figures (Output of Computation) | |||||||||||||||||||||||||||||||||
Input Parameters & R Code | |||||||||||||||||||||||||||||||||
| Parameters (Session): | |||||||||||||||||||||||||||||||||
| par1 = 0 ; | |||||||||||||||||||||||||||||||||
| Parameters (R input): | |||||||||||||||||||||||||||||||||
| par1 = 0 ; | |||||||||||||||||||||||||||||||||
| R code (references can be found in the software module): | |||||||||||||||||||||||||||||||||
if (par1 == '0') bw <- 'nrd0' | |||||||||||||||||||||||||||||||||