Free Statistics

of Irreproducible Research!

Author's title

Author*The author of this computation has been verified*
R Software Modulerwasp_centraltendency.wasp
Title produced by softwareCentral Tendency
Date of computationSun, 18 Oct 2009 13:10:40 -0600
Cite this page as followsStatistical Computations at FreeStatistics.org, Office for Research Development and Education, URL https://freestatistics.org/blog/index.php?v=date/2009/Oct/18/t1255893241udd181s0git2yv8.htm/, Retrieved Mon, 29 Apr 2024 14:56:51 +0000
Statistical Computations at FreeStatistics.org, Office for Research Development and Education, URL https://freestatistics.org/blog/index.php?pk=47470, Retrieved Mon, 29 Apr 2024 14:56:51 +0000
QR Codes:

Original text written by user:
IsPrivate?No (this computation is public)
User-defined keywordsShwWs3V2
Estimated Impact121
Family? (F = Feedback message, R = changed R code, M = changed R Module, P = changed Parameters, D = changed Data)
-     [Bivariate Data Series] [Bivariate dataset] [2008-01-05 23:51:08] [74be16979710d4c4e7c6647856088456]
F RMPD  [Univariate Explorative Data Analysis] [Colombia Coffee] [2008-01-07 14:21:11] [74be16979710d4c4e7c6647856088456]
F RMPD    [Univariate Data Series] [] [2009-10-14 08:30:28] [74be16979710d4c4e7c6647856088456]
- RMP       [Central Tendency] [WS3 part1 central...] [2009-10-18 13:33:13] [e0fc65a5811681d807296d590d5b45de]
-    D        [Central Tendency] [WS3 Part 2 Yt] [2009-10-18 16:41:28] [e0fc65a5811681d807296d590d5b45de]
-    D          [Central Tendency] [WS3 Part 2 Yt-Xt] [2009-10-18 18:24:53] [e0fc65a5811681d807296d590d5b45de]
-    D              [Central Tendency] [WS3Part2Yt/Xt] [2009-10-18 19:10:40] [51108381f3361ca8af49c4f74052c840] [Current]
-    D                [Central Tendency] [WS3Part2Yt*Xt] [2009-10-19 19:01:15] [e0fc65a5811681d807296d590d5b45de]
Feedback Forum

Post a new message
Dataseries X:
557,1102662
445,4847909
486,5340909
437,8314394
444,5009416
426,9238006
387,4718045
316,1365762
291,9309701
397,250699
313,3737185
200,5400372
524,6025105
492,7412626
494,0112577
483,557852
384,1178651
354,2627048
326,4841872
243,8965836
293,7868189
349,990797
252,5128393
168,6416583
463,688893
400,7759722
442,5694761
399,6995356
342,2891017
367,4831543
322,7739882
263,5942608
313,0730822
386,5517241
275,5341395
240,1579808
430,9061195
452,1613573
553,8884383
484,0616272
359,7648774
399,7359075
286,1388838
271,3378109
307,0683241
354,829932
305,3823849
227,0744729
464,9493854
410,9418657
472,3691311
436,7658962
373,7577223
443,912265
292,8284003
298,6400644
319,028014
330,6311936
318,979081
187,1831489


Summary of computational transaction
Raw Inputview raw input (R code)
Raw Outputview raw output of R engine
Computing time1 seconds
R Server'Gwilym Jenkins' @ 72.249.127.135
R Framework error message
Warning: there are blank lines in the 'Data' field.
Please, use NA for missing data - blank lines are simply
 deleted and are NOT treated as missing values.

\begin{tabular}{lllllllll}
\hline
Summary of computational transaction \tabularnewline
Raw Input & view raw input (R code)  \tabularnewline
Raw Output & view raw output of R engine  \tabularnewline
Computing time & 1 seconds \tabularnewline
R Server & 'Gwilym Jenkins' @ 72.249.127.135 \tabularnewline
R Framework error message & 
Warning: there are blank lines in the 'Data' field.
Please, use NA for missing data - blank lines are simply
 deleted and are NOT treated as missing values.
\tabularnewline \hline \end{tabular} %Source: https://freestatistics.org/blog/index.php?pk=47470&T=0

[TABLE]
[ROW][C]Summary of computational transaction[/C][/ROW]
[ROW][C]Raw Input[/C][C]view raw input (R code) [/C][/ROW]
[ROW][C]Raw Output[/C][C]view raw output of R engine [/C][/ROW]
[ROW][C]Computing time[/C][C]1 seconds[/C][/ROW]
[ROW][C]R Server[/C][C]'Gwilym Jenkins' @ 72.249.127.135[/C][/ROW]
[ROW][C]R Framework error message[/C][C]
Warning: there are blank lines in the 'Data' field.
Please, use NA for missing data - blank lines are simply
 deleted and are NOT treated as missing values.
[/C][/ROW] [/TABLE] Source: https://freestatistics.org/blog/index.php?pk=47470&T=0

Globally Unique Identifier (entire table): ba.freestatistics.org/blog/index.php?pk=47470&T=0

As an alternative you can also use a QR Code:  

The GUIDs for individual cells are displayed in the table below:

Summary of computational transaction
Raw Inputview raw input (R code)
Raw Outputview raw output of R engine
Computing time1 seconds
R Server'Gwilym Jenkins' @ 72.249.127.135
R Framework error message
Warning: there are blank lines in the 'Data' field.
Please, use NA for missing data - blank lines are simply
 deleted and are NOT treated as missing values.


Central Tendency - Ungrouped Data
MeasureValueS.E.Value/S.E.
Arithmetic Mean367.90371807166711.89744009498930.9229309107109
Geometric Mean355.761225984681
Harmonic Mean342.733964819955
Quadratic Mean379.083818619278
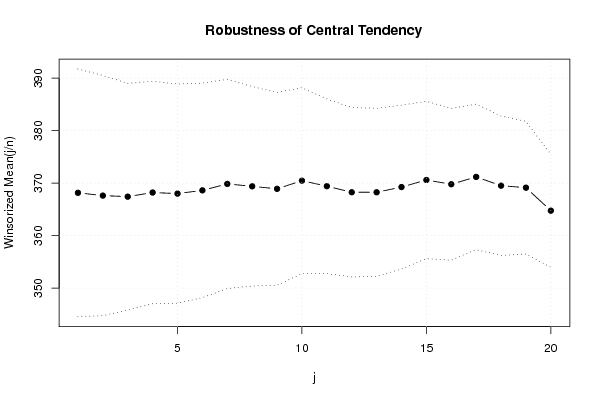
Winsorized Mean ( 1 / 20 )368.15904578333311.798994361386131.2025783305896
Winsorized Mean ( 2 / 20 )367.628077811.442001712333732.129699596507
Winsorized Mean ( 3 / 20 )367.42523694510.800687009265334.0186912767499
Winsorized Mean ( 4 / 20 )368.21280446510.598418627477334.7422400838535
Winsorized Mean ( 5 / 20 )368.0070903910.433791326740335.2706968028823
Winsorized Mean ( 6 / 20 )368.6214695910.216428780082936.0812449756058
Winsorized Mean ( 7 / 20 )369.8555283259.9636585437973537.120453967709
Winsorized Mean ( 8 / 20 )369.3961722183339.4984368595858838.8902066391626
Winsorized Mean ( 9 / 20 )368.9126596533339.1882458690601740.1504993347624
Winsorized Mean ( 10 / 20 )370.470034978.8558650411814841.8332972834661
Winsorized Mean ( 11 / 20 )369.4185359133338.3193136168491844.4049296525072
Winsorized Mean ( 12 / 20 )368.2627086733338.070029469332845.6333784247977
Winsorized Mean ( 13 / 20 )368.2571986883338.002705524731646.0165874591124
Winsorized Mean ( 14 / 20 )369.2522647657.8043139325268347.313866146008
Winsorized Mean ( 15 / 20 )370.6021476657.4961612738303649.4389240208583
Winsorized Mean ( 16 / 20 )369.7882549983337.226286758470151.1726516478045
Winsorized Mean ( 17 / 20 )371.187699226.9318859781503953.5478656732093
Winsorized Mean ( 18 / 20 )369.51995716.6402871886567155.6481890920672
Winsorized Mean ( 19 / 20 )369.1337943866676.3188339174533858.418024466045
Winsorized Mean ( 20 / 20 )364.7539843533335.3807924394385767.7881535960885
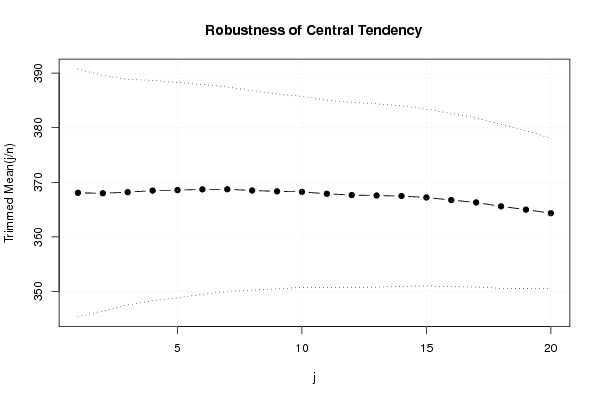
Trimmed Mean ( 1 / 20 )368.07708896206911.345872877205932.4414959470895
Trimmed Mean ( 2 / 20 )367.98927808214310.786123383336934.1169171725439
Trimmed Mean ( 3 / 20 )368.18994490555610.336063111828535.6218746849758
Trimmed Mean ( 4 / 20 )368.48406335192310.090286325049336.5186924812188
Trimmed Mean ( 5 / 20 )368.5654410189.8582326236901237.3865636049516
Trimmed Mean ( 6 / 20 )368.7050286759.6168342215328438.3395429495333
Trimmed Mean ( 7 / 20 )368.7231936934789.3724591952555439.3411361961577
Trimmed Mean ( 8 / 20 )368.5026090259.1265984413427540.3767746979766
Trimmed Mean ( 9 / 20 )368.3430441690488.9313889495052241.2414067119373
Trimmed Mean ( 10 / 20 )368.2481082558.7492417139545542.0891455847728
Trimmed Mean ( 11 / 20 )367.8972777210538.5823454385333542.8667524927688
Trimmed Mean ( 12 / 20 )367.6667840555568.4837859759240743.3375836093636
Trimmed Mean ( 13 / 20 )367.5791480823538.3927298485634143.7973287255602
Trimmed Mean ( 14 / 20 )367.4813523218758.259205741490844.4935462106002
Trimmed Mean ( 15 / 20 )367.228364838.1003786082047745.3347161400628
Trimmed Mean ( 16 / 20 )366.7463958535717.933113551811646.2298180226882
Trimmed Mean ( 17 / 20 )366.3076661692317.7418705225200547.3151372273266
Trimmed Mean ( 18 / 20 )365.590014257.5118408678693548.6684982656848
Trimmed Mean ( 19 / 20 )364.9945683636367.2296264573311450.4859511785034
Trimmed Mean ( 20 / 20 )364.341006366.8665298704917953.0604269160349
Median363.62401585
Midrange362.87596225
Midmean - Weighted Average at Xnp365.015839009677
Midmean - Weighted Average at X(n+1)p367.22836483
Midmean - Empirical Distribution Function365.015839009677
Midmean - Empirical Distribution Function - Averaging367.22836483
Midmean - Empirical Distribution Function - Interpolation367.22836483
Midmean - Closest Observation365.015839009677
Midmean - True Basic - Statistics Graphics Toolkit367.22836483
Midmean - MS Excel (old versions)367.481352321875
Number of observations60

\begin{tabular}{lllllllll}
\hline
Central Tendency - Ungrouped Data \tabularnewline
Measure & Value & S.E. & Value/S.E. \tabularnewline
Arithmetic Mean & 367.903718071667 & 11.897440094989 & 30.9229309107109 \tabularnewline
Geometric Mean & 355.761225984681 &  &  \tabularnewline
Harmonic Mean & 342.733964819955 &  &  \tabularnewline
Quadratic Mean & 379.083818619278 &  &  \tabularnewline
Winsorized Mean ( 1 / 20 ) & 368.159045783333 & 11.7989943613861 & 31.2025783305896 \tabularnewline
Winsorized Mean ( 2 / 20 ) & 367.6280778 & 11.4420017123337 & 32.129699596507 \tabularnewline
Winsorized Mean ( 3 / 20 ) & 367.425236945 & 10.8006870092653 & 34.0186912767499 \tabularnewline
Winsorized Mean ( 4 / 20 ) & 368.212804465 & 10.5984186274773 & 34.7422400838535 \tabularnewline
Winsorized Mean ( 5 / 20 ) & 368.00709039 & 10.4337913267403 & 35.2706968028823 \tabularnewline
Winsorized Mean ( 6 / 20 ) & 368.62146959 & 10.2164287800829 & 36.0812449756058 \tabularnewline
Winsorized Mean ( 7 / 20 ) & 369.855528325 & 9.96365854379735 & 37.120453967709 \tabularnewline
Winsorized Mean ( 8 / 20 ) & 369.396172218333 & 9.49843685958588 & 38.8902066391626 \tabularnewline
Winsorized Mean ( 9 / 20 ) & 368.912659653333 & 9.18824586906017 & 40.1504993347624 \tabularnewline
Winsorized Mean ( 10 / 20 ) & 370.47003497 & 8.85586504118148 & 41.8332972834661 \tabularnewline
Winsorized Mean ( 11 / 20 ) & 369.418535913333 & 8.31931361684918 & 44.4049296525072 \tabularnewline
Winsorized Mean ( 12 / 20 ) & 368.262708673333 & 8.0700294693328 & 45.6333784247977 \tabularnewline
Winsorized Mean ( 13 / 20 ) & 368.257198688333 & 8.0027055247316 & 46.0165874591124 \tabularnewline
Winsorized Mean ( 14 / 20 ) & 369.252264765 & 7.80431393252683 & 47.313866146008 \tabularnewline
Winsorized Mean ( 15 / 20 ) & 370.602147665 & 7.49616127383036 & 49.4389240208583 \tabularnewline
Winsorized Mean ( 16 / 20 ) & 369.788254998333 & 7.2262867584701 & 51.1726516478045 \tabularnewline
Winsorized Mean ( 17 / 20 ) & 371.18769922 & 6.93188597815039 & 53.5478656732093 \tabularnewline
Winsorized Mean ( 18 / 20 ) & 369.5199571 & 6.64028718865671 & 55.6481890920672 \tabularnewline
Winsorized Mean ( 19 / 20 ) & 369.133794386667 & 6.31883391745338 & 58.418024466045 \tabularnewline
Winsorized Mean ( 20 / 20 ) & 364.753984353333 & 5.38079243943857 & 67.7881535960885 \tabularnewline
Trimmed Mean ( 1 / 20 ) & 368.077088962069 & 11.3458728772059 & 32.4414959470895 \tabularnewline
Trimmed Mean ( 2 / 20 ) & 367.989278082143 & 10.7861233833369 & 34.1169171725439 \tabularnewline
Trimmed Mean ( 3 / 20 ) & 368.189944905556 & 10.3360631118285 & 35.6218746849758 \tabularnewline
Trimmed Mean ( 4 / 20 ) & 368.484063351923 & 10.0902863250493 & 36.5186924812188 \tabularnewline
Trimmed Mean ( 5 / 20 ) & 368.565441018 & 9.85823262369012 & 37.3865636049516 \tabularnewline
Trimmed Mean ( 6 / 20 ) & 368.705028675 & 9.61683422153284 & 38.3395429495333 \tabularnewline
Trimmed Mean ( 7 / 20 ) & 368.723193693478 & 9.37245919525554 & 39.3411361961577 \tabularnewline
Trimmed Mean ( 8 / 20 ) & 368.502609025 & 9.12659844134275 & 40.3767746979766 \tabularnewline
Trimmed Mean ( 9 / 20 ) & 368.343044169048 & 8.93138894950522 & 41.2414067119373 \tabularnewline
Trimmed Mean ( 10 / 20 ) & 368.248108255 & 8.74924171395455 & 42.0891455847728 \tabularnewline
Trimmed Mean ( 11 / 20 ) & 367.897277721053 & 8.58234543853335 & 42.8667524927688 \tabularnewline
Trimmed Mean ( 12 / 20 ) & 367.666784055556 & 8.48378597592407 & 43.3375836093636 \tabularnewline
Trimmed Mean ( 13 / 20 ) & 367.579148082353 & 8.39272984856341 & 43.7973287255602 \tabularnewline
Trimmed Mean ( 14 / 20 ) & 367.481352321875 & 8.2592057414908 & 44.4935462106002 \tabularnewline
Trimmed Mean ( 15 / 20 ) & 367.22836483 & 8.10037860820477 & 45.3347161400628 \tabularnewline
Trimmed Mean ( 16 / 20 ) & 366.746395853571 & 7.9331135518116 & 46.2298180226882 \tabularnewline
Trimmed Mean ( 17 / 20 ) & 366.307666169231 & 7.74187052252005 & 47.3151372273266 \tabularnewline
Trimmed Mean ( 18 / 20 ) & 365.59001425 & 7.51184086786935 & 48.6684982656848 \tabularnewline
Trimmed Mean ( 19 / 20 ) & 364.994568363636 & 7.22962645733114 & 50.4859511785034 \tabularnewline
Trimmed Mean ( 20 / 20 ) & 364.34100636 & 6.86652987049179 & 53.0604269160349 \tabularnewline
Median & 363.62401585 &  &  \tabularnewline
Midrange & 362.87596225 &  &  \tabularnewline
Midmean - Weighted Average at Xnp & 365.015839009677 &  &  \tabularnewline
Midmean - Weighted Average at X(n+1)p & 367.22836483 &  &  \tabularnewline
Midmean - Empirical Distribution Function & 365.015839009677 &  &  \tabularnewline
Midmean - Empirical Distribution Function - Averaging & 367.22836483 &  &  \tabularnewline
Midmean - Empirical Distribution Function - Interpolation & 367.22836483 &  &  \tabularnewline
Midmean - Closest Observation & 365.015839009677 &  &  \tabularnewline
Midmean - True Basic - Statistics Graphics Toolkit & 367.22836483 &  &  \tabularnewline
Midmean - MS Excel (old versions) & 367.481352321875 &  &  \tabularnewline
Number of observations & 60 &  &  \tabularnewline
\hline
\end{tabular}
%Source: https://freestatistics.org/blog/index.php?pk=47470&T=1

[TABLE]
[ROW][C]Central Tendency - Ungrouped Data[/C][/ROW]
[ROW][C]Measure[/C][C]Value[/C][C]S.E.[/C][C]Value/S.E.[/C][/ROW]
[ROW][C]Arithmetic Mean[/C][C]367.903718071667[/C][C]11.897440094989[/C][C]30.9229309107109[/C][/ROW]
[ROW][C]Geometric Mean[/C][C]355.761225984681[/C][C][/C][C][/C][/ROW]
[ROW][C]Harmonic Mean[/C][C]342.733964819955[/C][C][/C][C][/C][/ROW]
[ROW][C]Quadratic Mean[/C][C]379.083818619278[/C][C][/C][C][/C][/ROW]
[ROW][C]Winsorized Mean ( 1 / 20 )[/C][C]368.159045783333[/C][C]11.7989943613861[/C][C]31.2025783305896[/C][/ROW]
[ROW][C]Winsorized Mean ( 2 / 20 )[/C][C]367.6280778[/C][C]11.4420017123337[/C][C]32.129699596507[/C][/ROW]
[ROW][C]Winsorized Mean ( 3 / 20 )[/C][C]367.425236945[/C][C]10.8006870092653[/C][C]34.0186912767499[/C][/ROW]
[ROW][C]Winsorized Mean ( 4 / 20 )[/C][C]368.212804465[/C][C]10.5984186274773[/C][C]34.7422400838535[/C][/ROW]
[ROW][C]Winsorized Mean ( 5 / 20 )[/C][C]368.00709039[/C][C]10.4337913267403[/C][C]35.2706968028823[/C][/ROW]
[ROW][C]Winsorized Mean ( 6 / 20 )[/C][C]368.62146959[/C][C]10.2164287800829[/C][C]36.0812449756058[/C][/ROW]
[ROW][C]Winsorized Mean ( 7 / 20 )[/C][C]369.855528325[/C][C]9.96365854379735[/C][C]37.120453967709[/C][/ROW]
[ROW][C]Winsorized Mean ( 8 / 20 )[/C][C]369.396172218333[/C][C]9.49843685958588[/C][C]38.8902066391626[/C][/ROW]
[ROW][C]Winsorized Mean ( 9 / 20 )[/C][C]368.912659653333[/C][C]9.18824586906017[/C][C]40.1504993347624[/C][/ROW]
[ROW][C]Winsorized Mean ( 10 / 20 )[/C][C]370.47003497[/C][C]8.85586504118148[/C][C]41.8332972834661[/C][/ROW]
[ROW][C]Winsorized Mean ( 11 / 20 )[/C][C]369.418535913333[/C][C]8.31931361684918[/C][C]44.4049296525072[/C][/ROW]
[ROW][C]Winsorized Mean ( 12 / 20 )[/C][C]368.262708673333[/C][C]8.0700294693328[/C][C]45.6333784247977[/C][/ROW]
[ROW][C]Winsorized Mean ( 13 / 20 )[/C][C]368.257198688333[/C][C]8.0027055247316[/C][C]46.0165874591124[/C][/ROW]
[ROW][C]Winsorized Mean ( 14 / 20 )[/C][C]369.252264765[/C][C]7.80431393252683[/C][C]47.313866146008[/C][/ROW]
[ROW][C]Winsorized Mean ( 15 / 20 )[/C][C]370.602147665[/C][C]7.49616127383036[/C][C]49.4389240208583[/C][/ROW]
[ROW][C]Winsorized Mean ( 16 / 20 )[/C][C]369.788254998333[/C][C]7.2262867584701[/C][C]51.1726516478045[/C][/ROW]
[ROW][C]Winsorized Mean ( 17 / 20 )[/C][C]371.18769922[/C][C]6.93188597815039[/C][C]53.5478656732093[/C][/ROW]
[ROW][C]Winsorized Mean ( 18 / 20 )[/C][C]369.5199571[/C][C]6.64028718865671[/C][C]55.6481890920672[/C][/ROW]
[ROW][C]Winsorized Mean ( 19 / 20 )[/C][C]369.133794386667[/C][C]6.31883391745338[/C][C]58.418024466045[/C][/ROW]
[ROW][C]Winsorized Mean ( 20 / 20 )[/C][C]364.753984353333[/C][C]5.38079243943857[/C][C]67.7881535960885[/C][/ROW]
[ROW][C]Trimmed Mean ( 1 / 20 )[/C][C]368.077088962069[/C][C]11.3458728772059[/C][C]32.4414959470895[/C][/ROW]
[ROW][C]Trimmed Mean ( 2 / 20 )[/C][C]367.989278082143[/C][C]10.7861233833369[/C][C]34.1169171725439[/C][/ROW]
[ROW][C]Trimmed Mean ( 3 / 20 )[/C][C]368.189944905556[/C][C]10.3360631118285[/C][C]35.6218746849758[/C][/ROW]
[ROW][C]Trimmed Mean ( 4 / 20 )[/C][C]368.484063351923[/C][C]10.0902863250493[/C][C]36.5186924812188[/C][/ROW]
[ROW][C]Trimmed Mean ( 5 / 20 )[/C][C]368.565441018[/C][C]9.85823262369012[/C][C]37.3865636049516[/C][/ROW]
[ROW][C]Trimmed Mean ( 6 / 20 )[/C][C]368.705028675[/C][C]9.61683422153284[/C][C]38.3395429495333[/C][/ROW]
[ROW][C]Trimmed Mean ( 7 / 20 )[/C][C]368.723193693478[/C][C]9.37245919525554[/C][C]39.3411361961577[/C][/ROW]
[ROW][C]Trimmed Mean ( 8 / 20 )[/C][C]368.502609025[/C][C]9.12659844134275[/C][C]40.3767746979766[/C][/ROW]
[ROW][C]Trimmed Mean ( 9 / 20 )[/C][C]368.343044169048[/C][C]8.93138894950522[/C][C]41.2414067119373[/C][/ROW]
[ROW][C]Trimmed Mean ( 10 / 20 )[/C][C]368.248108255[/C][C]8.74924171395455[/C][C]42.0891455847728[/C][/ROW]
[ROW][C]Trimmed Mean ( 11 / 20 )[/C][C]367.897277721053[/C][C]8.58234543853335[/C][C]42.8667524927688[/C][/ROW]
[ROW][C]Trimmed Mean ( 12 / 20 )[/C][C]367.666784055556[/C][C]8.48378597592407[/C][C]43.3375836093636[/C][/ROW]
[ROW][C]Trimmed Mean ( 13 / 20 )[/C][C]367.579148082353[/C][C]8.39272984856341[/C][C]43.7973287255602[/C][/ROW]
[ROW][C]Trimmed Mean ( 14 / 20 )[/C][C]367.481352321875[/C][C]8.2592057414908[/C][C]44.4935462106002[/C][/ROW]
[ROW][C]Trimmed Mean ( 15 / 20 )[/C][C]367.22836483[/C][C]8.10037860820477[/C][C]45.3347161400628[/C][/ROW]
[ROW][C]Trimmed Mean ( 16 / 20 )[/C][C]366.746395853571[/C][C]7.9331135518116[/C][C]46.2298180226882[/C][/ROW]
[ROW][C]Trimmed Mean ( 17 / 20 )[/C][C]366.307666169231[/C][C]7.74187052252005[/C][C]47.3151372273266[/C][/ROW]
[ROW][C]Trimmed Mean ( 18 / 20 )[/C][C]365.59001425[/C][C]7.51184086786935[/C][C]48.6684982656848[/C][/ROW]
[ROW][C]Trimmed Mean ( 19 / 20 )[/C][C]364.994568363636[/C][C]7.22962645733114[/C][C]50.4859511785034[/C][/ROW]
[ROW][C]Trimmed Mean ( 20 / 20 )[/C][C]364.34100636[/C][C]6.86652987049179[/C][C]53.0604269160349[/C][/ROW]
[ROW][C]Median[/C][C]363.62401585[/C][C][/C][C][/C][/ROW]
[ROW][C]Midrange[/C][C]362.87596225[/C][C][/C][C][/C][/ROW]
[ROW][C]Midmean - Weighted Average at Xnp[/C][C]365.015839009677[/C][C][/C][C][/C][/ROW]
[ROW][C]Midmean - Weighted Average at X(n+1)p[/C][C]367.22836483[/C][C][/C][C][/C][/ROW]
[ROW][C]Midmean - Empirical Distribution Function[/C][C]365.015839009677[/C][C][/C][C][/C][/ROW]
[ROW][C]Midmean - Empirical Distribution Function - Averaging[/C][C]367.22836483[/C][C][/C][C][/C][/ROW]
[ROW][C]Midmean - Empirical Distribution Function - Interpolation[/C][C]367.22836483[/C][C][/C][C][/C][/ROW]
[ROW][C]Midmean - Closest Observation[/C][C]365.015839009677[/C][C][/C][C][/C][/ROW]
[ROW][C]Midmean - True Basic - Statistics Graphics Toolkit[/C][C]367.22836483[/C][C][/C][C][/C][/ROW]
[ROW][C]Midmean - MS Excel (old versions)[/C][C]367.481352321875[/C][C][/C][C][/C][/ROW]
[ROW][C]Number of observations[/C][C]60[/C][C][/C][C][/C][/ROW]
[/TABLE]
Source: https://freestatistics.org/blog/index.php?pk=47470&T=1

Globally Unique Identifier (entire table): ba.freestatistics.org/blog/index.php?pk=47470&T=1

As an alternative you can also use a QR Code:  

The GUIDs for individual cells are displayed in the table below:

Central Tendency - Ungrouped Data
MeasureValueS.E.Value/S.E.
Arithmetic Mean367.90371807166711.89744009498930.9229309107109
Geometric Mean355.761225984681
Harmonic Mean342.733964819955
Quadratic Mean379.083818619278
Winsorized Mean ( 1 / 20 )368.15904578333311.798994361386131.2025783305896
Winsorized Mean ( 2 / 20 )367.628077811.442001712333732.129699596507
Winsorized Mean ( 3 / 20 )367.42523694510.800687009265334.0186912767499
Winsorized Mean ( 4 / 20 )368.21280446510.598418627477334.7422400838535
Winsorized Mean ( 5 / 20 )368.0070903910.433791326740335.2706968028823
Winsorized Mean ( 6 / 20 )368.6214695910.216428780082936.0812449756058
Winsorized Mean ( 7 / 20 )369.8555283259.9636585437973537.120453967709
Winsorized Mean ( 8 / 20 )369.3961722183339.4984368595858838.8902066391626
Winsorized Mean ( 9 / 20 )368.9126596533339.1882458690601740.1504993347624
Winsorized Mean ( 10 / 20 )370.470034978.8558650411814841.8332972834661
Winsorized Mean ( 11 / 20 )369.4185359133338.3193136168491844.4049296525072
Winsorized Mean ( 12 / 20 )368.2627086733338.070029469332845.6333784247977
Winsorized Mean ( 13 / 20 )368.2571986883338.002705524731646.0165874591124
Winsorized Mean ( 14 / 20 )369.2522647657.8043139325268347.313866146008
Winsorized Mean ( 15 / 20 )370.6021476657.4961612738303649.4389240208583
Winsorized Mean ( 16 / 20 )369.7882549983337.226286758470151.1726516478045
Winsorized Mean ( 17 / 20 )371.187699226.9318859781503953.5478656732093
Winsorized Mean ( 18 / 20 )369.51995716.6402871886567155.6481890920672
Winsorized Mean ( 19 / 20 )369.1337943866676.3188339174533858.418024466045
Winsorized Mean ( 20 / 20 )364.7539843533335.3807924394385767.7881535960885
Trimmed Mean ( 1 / 20 )368.07708896206911.345872877205932.4414959470895
Trimmed Mean ( 2 / 20 )367.98927808214310.786123383336934.1169171725439
Trimmed Mean ( 3 / 20 )368.18994490555610.336063111828535.6218746849758
Trimmed Mean ( 4 / 20 )368.48406335192310.090286325049336.5186924812188
Trimmed Mean ( 5 / 20 )368.5654410189.8582326236901237.3865636049516
Trimmed Mean ( 6 / 20 )368.7050286759.6168342215328438.3395429495333
Trimmed Mean ( 7 / 20 )368.7231936934789.3724591952555439.3411361961577
Trimmed Mean ( 8 / 20 )368.5026090259.1265984413427540.3767746979766
Trimmed Mean ( 9 / 20 )368.3430441690488.9313889495052241.2414067119373
Trimmed Mean ( 10 / 20 )368.2481082558.7492417139545542.0891455847728
Trimmed Mean ( 11 / 20 )367.8972777210538.5823454385333542.8667524927688
Trimmed Mean ( 12 / 20 )367.6667840555568.4837859759240743.3375836093636
Trimmed Mean ( 13 / 20 )367.5791480823538.3927298485634143.7973287255602
Trimmed Mean ( 14 / 20 )367.4813523218758.259205741490844.4935462106002
Trimmed Mean ( 15 / 20 )367.228364838.1003786082047745.3347161400628
Trimmed Mean ( 16 / 20 )366.7463958535717.933113551811646.2298180226882
Trimmed Mean ( 17 / 20 )366.3076661692317.7418705225200547.3151372273266
Trimmed Mean ( 18 / 20 )365.590014257.5118408678693548.6684982656848
Trimmed Mean ( 19 / 20 )364.9945683636367.2296264573311450.4859511785034
Trimmed Mean ( 20 / 20 )364.341006366.8665298704917953.0604269160349
Median363.62401585
Midrange362.87596225
Midmean - Weighted Average at Xnp365.015839009677
Midmean - Weighted Average at X(n+1)p367.22836483
Midmean - Empirical Distribution Function365.015839009677
Midmean - Empirical Distribution Function - Averaging367.22836483
Midmean - Empirical Distribution Function - Interpolation367.22836483
Midmean - Closest Observation365.015839009677
Midmean - True Basic - Statistics Graphics Toolkit367.22836483
Midmean - MS Excel (old versions)367.481352321875
Number of observations60


Parameters (Session):
Parameters (R input):
R code (references can be found in the software module):
geomean <- function(x) {
return(exp(mean(log(x))))
}
harmean <- function(x) {
return(1/mean(1/x))
}
quamean <- function(x) {
return(sqrt(mean(x*x)))
}
winmean <- function(x) {
x <-sort(x[!is.na(x)])
n<-length(x)
denom <- 3
nodenom <- n/denom
if (nodenom>40) denom <- n/40
sqrtn = sqrt(n)
roundnodenom = floor(nodenom)
win <- array(NA,dim=c(roundnodenom,2))
for (j in 1:roundnodenom) {
win[j,1] <- (j*x[j+1]+sum(x[(j+1):(n-j)])+j*x[n-j])/n
win[j,2] <- sd(c(rep(x[j+1],j),x[(j+1):(n-j)],rep(x[n-j],j)))/sqrtn
}
return(win)
}
trimean <- function(x) {
x <-sort(x[!is.na(x)])
n<-length(x)
denom <- 3
nodenom <- n/denom
if (nodenom>40) denom <- n/40
sqrtn = sqrt(n)
roundnodenom = floor(nodenom)
tri <- array(NA,dim=c(roundnodenom,2))
for (j in 1:roundnodenom) {
tri[j,1] <- mean(x,trim=j/n)
tri[j,2] <- sd(x[(j+1):(n-j)]) / sqrt(n-j*2)
}
return(tri)
}
midrange <- function(x) {
return((max(x)+min(x))/2)
}
q1 <- function(data,n,p,i,f) {
np <- n*p;
i <<- floor(np)
f <<- np - i
qvalue <- (1-f)*data[i] + f*data[i+1]
}
q2 <- function(data,n,p,i,f) {
np <- (n+1)*p
i <<- floor(np)
f <<- np - i
qvalue <- (1-f)*data[i] + f*data[i+1]
}
q3 <- function(data,n,p,i,f) {
np <- n*p
i <<- floor(np)
f <<- np - i
if (f==0) {
qvalue <- data[i]
} else {
qvalue <- data[i+1]
}
}
q4 <- function(data,n,p,i,f) {
np <- n*p
i <<- floor(np)
f <<- np - i
if (f==0) {
qvalue <- (data[i]+data[i+1])/2
} else {
qvalue <- data[i+1]
}
}
q5 <- function(data,n,p,i,f) {
np <- (n-1)*p
i <<- floor(np)
f <<- np - i
if (f==0) {
qvalue <- data[i+1]
} else {
qvalue <- data[i+1] + f*(data[i+2]-data[i+1])
}
}
q6 <- function(data,n,p,i,f) {
np <- n*p+0.5
i <<- floor(np)
f <<- np - i
qvalue <- data[i]
}
q7 <- function(data,n,p,i,f) {
np <- (n+1)*p
i <<- floor(np)
f <<- np - i
if (f==0) {
qvalue <- data[i]
} else {
qvalue <- f*data[i] + (1-f)*data[i+1]
}
}
q8 <- function(data,n,p,i,f) {
np <- (n+1)*p
i <<- floor(np)
f <<- np - i
if (f==0) {
qvalue <- data[i]
} else {
if (f == 0.5) {
qvalue <- (data[i]+data[i+1])/2
} else {
if (f < 0.5) {
qvalue <- data[i]
} else {
qvalue <- data[i+1]
}
}
}
}
midmean <- function(x,def) {
x <-sort(x[!is.na(x)])
n<-length(x)
if (def==1) {
qvalue1 <- q1(x,n,0.25,i,f)
qvalue3 <- q1(x,n,0.75,i,f)
}
if (def==2) {
qvalue1 <- q2(x,n,0.25,i,f)
qvalue3 <- q2(x,n,0.75,i,f)
}
if (def==3) {
qvalue1 <- q3(x,n,0.25,i,f)
qvalue3 <- q3(x,n,0.75,i,f)
}
if (def==4) {
qvalue1 <- q4(x,n,0.25,i,f)
qvalue3 <- q4(x,n,0.75,i,f)
}
if (def==5) {
qvalue1 <- q5(x,n,0.25,i,f)
qvalue3 <- q5(x,n,0.75,i,f)
}
if (def==6) {
qvalue1 <- q6(x,n,0.25,i,f)
qvalue3 <- q6(x,n,0.75,i,f)
}
if (def==7) {
qvalue1 <- q7(x,n,0.25,i,f)
qvalue3 <- q7(x,n,0.75,i,f)
}
if (def==8) {
qvalue1 <- q8(x,n,0.25,i,f)
qvalue3 <- q8(x,n,0.75,i,f)
}
midm <- 0
myn <- 0
roundno4 <- round(n/4)
round3no4 <- round(3*n/4)
for (i in 1:n) {
if ((x[i]>=qvalue1) & (x[i]<=qvalue3)){
midm = midm + x[i]
myn = myn + 1
}
}
midm = midm / myn
return(midm)
}
(arm <- mean(x))
sqrtn <- sqrt(length(x))
(armse <- sd(x) / sqrtn)
(armose <- arm / armse)
(geo <- geomean(x))
(har <- harmean(x))
(qua <- quamean(x))
(win <- winmean(x))
(tri <- trimean(x))
(midr <- midrange(x))
midm <- array(NA,dim=8)
for (j in 1:8) midm[j] <- midmean(x,j)
midm
bitmap(file='test1.png')
lb <- win[,1] - 2*win[,2]
ub <- win[,1] + 2*win[,2]
if ((ylimmin == '') | (ylimmax == '')) plot(win[,1],type='b',main=main, xlab='j', pch=19, ylab='Winsorized Mean(j/n)', ylim=c(min(lb),max(ub))) else plot(win[,1],type='l',main=main, xlab='j', pch=19, ylab='Winsorized Mean(j/n)', ylim=c(ylimmin,ylimmax))
lines(ub,lty=3)
lines(lb,lty=3)
grid()
dev.off()
bitmap(file='test2.png')
lb <- tri[,1] - 2*tri[,2]
ub <- tri[,1] + 2*tri[,2]
if ((ylimmin == '') | (ylimmax == '')) plot(tri[,1],type='b',main=main, xlab='j', pch=19, ylab='Trimmed Mean(j/n)', ylim=c(min(lb),max(ub))) else plot(tri[,1],type='l',main=main, xlab='j', pch=19, ylab='Trimmed Mean(j/n)', ylim=c(ylimmin,ylimmax))
lines(ub,lty=3)
lines(lb,lty=3)
grid()
dev.off()
load(file='createtable')
a<-table.start()
a<-table.row.start(a)
a<-table.element(a,'Central Tendency - Ungrouped Data',4,TRUE)
a<-table.row.end(a)
a<-table.row.start(a)
a<-table.element(a,'Measure',header=TRUE)
a<-table.element(a,'Value',header=TRUE)
a<-table.element(a,'S.E.',header=TRUE)
a<-table.element(a,'Value/S.E.',header=TRUE)
a<-table.row.end(a)
a<-table.row.start(a)
a<-table.element(a,hyperlink('arithmetic_mean.htm', 'Arithmetic Mean', 'click to view the definition of the Arithmetic Mean'),header=TRUE)
a<-table.element(a,arm)
a<-table.element(a,hyperlink('arithmetic_mean_standard_error.htm', armse, 'click to view the definition of the Standard Error of the Arithmetic Mean'))
a<-table.element(a,armose)
a<-table.row.end(a)
a<-table.row.start(a)
a<-table.element(a,hyperlink('geometric_mean.htm', 'Geometric Mean', 'click to view the definition of the Geometric Mean'),header=TRUE)
a<-table.element(a,geo)
a<-table.element(a,'')
a<-table.row.end(a)
a<-table.row.start(a)
a<-table.element(a,hyperlink('harmonic_mean.htm', 'Harmonic Mean', 'click to view the definition of the Harmonic Mean'),header=TRUE)
a<-table.element(a,har)
a<-table.element(a,'')
a<-table.row.end(a)
a<-table.row.start(a)
a<-table.element(a,hyperlink('quadratic_mean.htm', 'Quadratic Mean', 'click to view the definition of the Quadratic Mean'),header=TRUE)
a<-table.element(a,qua)
a<-table.element(a,'')
a<-table.row.end(a)
for (j in 1:length(win[,1])) {
a<-table.row.start(a)
mylabel <- paste('Winsorized Mean (',j)
mylabel <- paste(mylabel,'/')
mylabel <- paste(mylabel,length(win[,1]))
mylabel <- paste(mylabel,')')
a<-table.element(a,hyperlink('winsorized_mean.htm', mylabel, 'click to view the definition of the Winsorized Mean'),header=TRUE)
a<-table.element(a,win[j,1])
a<-table.element(a,win[j,2])
a<-table.element(a,win[j,1]/win[j,2])
a<-table.row.end(a)
}
for (j in 1:length(tri[,1])) {
a<-table.row.start(a)
mylabel <- paste('Trimmed Mean (',j)
mylabel <- paste(mylabel,'/')
mylabel <- paste(mylabel,length(tri[,1]))
mylabel <- paste(mylabel,')')
a<-table.element(a,hyperlink('arithmetic_mean.htm', mylabel, 'click to view the definition of the Trimmed Mean'),header=TRUE)
a<-table.element(a,tri[j,1])
a<-table.element(a,tri[j,2])
a<-table.element(a,tri[j,1]/tri[j,2])
a<-table.row.end(a)
}
a<-table.row.start(a)
a<-table.element(a,hyperlink('median_1.htm', 'Median', 'click to view the definition of the Median'),header=TRUE)
a<-table.element(a,median(x))
a<-table.element(a,'')
a<-table.row.end(a)
a<-table.row.start(a)
a<-table.element(a,hyperlink('midrange.htm', 'Midrange', 'click to view the definition of the Midrange'),header=TRUE)
a<-table.element(a,midr)
a<-table.element(a,'')
a<-table.row.end(a)
a<-table.row.start(a)
mymid <- hyperlink('midmean.htm', 'Midmean', 'click to view the definition of the Midmean')
mylabel <- paste(mymid,hyperlink('method_1.htm','Weighted Average at Xnp',''),sep=' - ')
a<-table.element(a,mylabel,header=TRUE)
a<-table.element(a,midm[1])
a<-table.element(a,'')
a<-table.row.end(a)
a<-table.row.start(a)
mymid <- hyperlink('midmean.htm', 'Midmean', 'click to view the definition of the Midmean')
mylabel <- paste(mymid,hyperlink('method_2.htm','Weighted Average at X(n+1)p',''),sep=' - ')
a<-table.element(a,mylabel,header=TRUE)
a<-table.element(a,midm[2])
a<-table.element(a,'')
a<-table.row.end(a)
a<-table.row.start(a)
mymid <- hyperlink('midmean.htm', 'Midmean', 'click to view the definition of the Midmean')
mylabel <- paste(mymid,hyperlink('method_3.htm','Empirical Distribution Function',''),sep=' - ')
a<-table.element(a,mylabel,header=TRUE)
a<-table.element(a,midm[3])
a<-table.element(a,'')
a<-table.row.end(a)
a<-table.row.start(a)
mymid <- hyperlink('midmean.htm', 'Midmean', 'click to view the definition of the Midmean')
mylabel <- paste(mymid,hyperlink('method_4.htm','Empirical Distribution Function - Averaging',''),sep=' - ')
a<-table.element(a,mylabel,header=TRUE)
a<-table.element(a,midm[4])
a<-table.element(a,'')
a<-table.row.end(a)
a<-table.row.start(a)
mymid <- hyperlink('midmean.htm', 'Midmean', 'click to view the definition of the Midmean')
mylabel <- paste(mymid,hyperlink('method_5.htm','Empirical Distribution Function - Interpolation',''),sep=' - ')
a<-table.element(a,mylabel,header=TRUE)
a<-table.element(a,midm[5])
a<-table.element(a,'')
a<-table.row.end(a)
a<-table.row.start(a)
mymid <- hyperlink('midmean.htm', 'Midmean', 'click to view the definition of the Midmean')
mylabel <- paste(mymid,hyperlink('method_6.htm','Closest Observation',''),sep=' - ')
a<-table.element(a,mylabel,header=TRUE)
a<-table.element(a,midm[6])
a<-table.element(a,'')
a<-table.row.end(a)
a<-table.row.start(a)
mymid <- hyperlink('midmean.htm', 'Midmean', 'click to view the definition of the Midmean')
mylabel <- paste(mymid,hyperlink('method_7.htm','True Basic - Statistics Graphics Toolkit',''),sep=' - ')
a<-table.element(a,mylabel,header=TRUE)
a<-table.element(a,midm[7])
a<-table.element(a,'')
a<-table.row.end(a)
a<-table.row.start(a)
mymid <- hyperlink('midmean.htm', 'Midmean', 'click to view the definition of the Midmean')
mylabel <- paste(mymid,hyperlink('method_8.htm','MS Excel (old versions)',''),sep=' - ')
a<-table.element(a,mylabel,header=TRUE)
a<-table.element(a,midm[8])
a<-table.element(a,'')
a<-table.row.end(a)
a<-table.row.start(a)
a<-table.element(a,'Number of observations',header=TRUE)
a<-table.element(a,length(x))
a<-table.element(a,'')
a<-table.row.end(a)
a<-table.end(a)
table.save(a,file='mytable.tab')