Free Statistics
of Irreproducible Research!
Description of Statistical Computation | |||||||||||||||||||||||||||||||||||||
|---|---|---|---|---|---|---|---|---|---|---|---|---|---|---|---|---|---|---|---|---|---|---|---|---|---|---|---|---|---|---|---|---|---|---|---|---|---|
| Author's title | |||||||||||||||||||||||||||||||||||||
| Author | *The author of this computation has been verified* | ||||||||||||||||||||||||||||||||||||
| R Software Module | rwasp_density.wasp | ||||||||||||||||||||||||||||||||||||
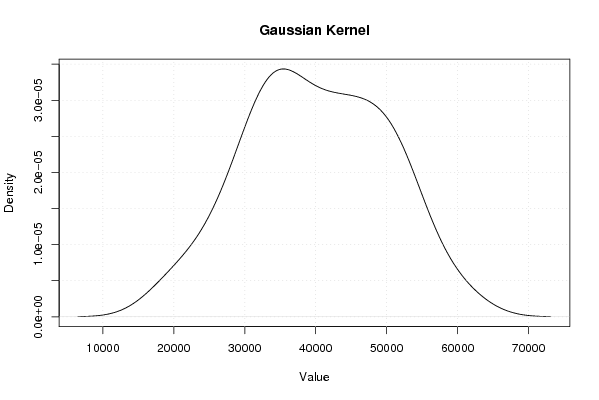
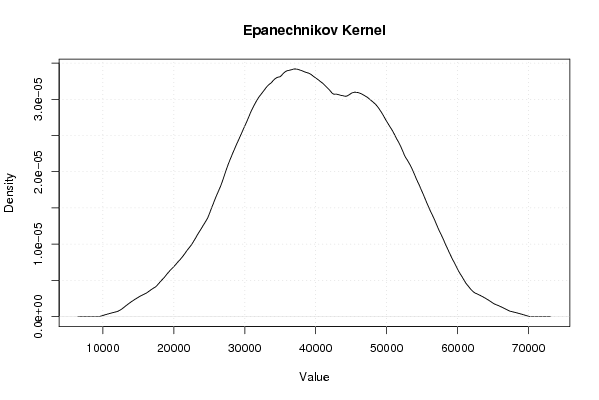
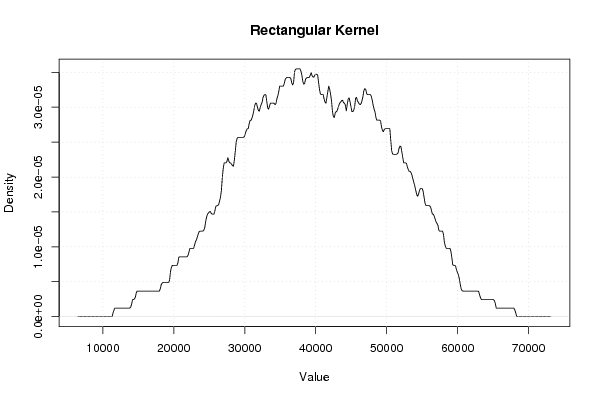
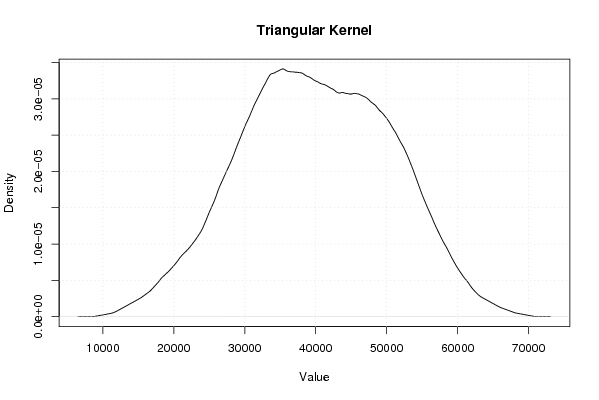
| Title produced by software | Kernel Density Estimation | ||||||||||||||||||||||||||||||||||||
| Date of computation | Sun, 18 Oct 2009 13:03:19 -0600 | ||||||||||||||||||||||||||||||||||||
| Cite this page as follows | Statistical Computations at FreeStatistics.org, Office for Research Development and Education, URL https://freestatistics.org/blog/index.php?v=date/2009/Oct/18/t12558927005so6qyhqwgyf2pb.htm/, Retrieved Mon, 29 Apr 2024 09:20:29 +0000 | ||||||||||||||||||||||||||||||||||||
| Statistical Computations at FreeStatistics.org, Office for Research Development and Education, URL https://freestatistics.org/blog/index.php?pk=47467, Retrieved Mon, 29 Apr 2024 09:20:29 +0000 | |||||||||||||||||||||||||||||||||||||
| QR Codes: | |||||||||||||||||||||||||||||||||||||
|
| |||||||||||||||||||||||||||||||||||||
| Original text written by user: | |||||||||||||||||||||||||||||||||||||
| IsPrivate? | No (this computation is public) | ||||||||||||||||||||||||||||||||||||
| User-defined keywords | ShwWs3V2 | ||||||||||||||||||||||||||||||||||||
| Estimated Impact | 134 | ||||||||||||||||||||||||||||||||||||
Tree of Dependent Computations | |||||||||||||||||||||||||||||||||||||
| Family? (F = Feedback message, R = changed R code, M = changed R Module, P = changed Parameters, D = changed Data) | |||||||||||||||||||||||||||||||||||||
| - [Bivariate Data Series] [Bivariate dataset] [2008-01-05 23:51:08] [74be16979710d4c4e7c6647856088456] F RMPD [Univariate Explorative Data Analysis] [Colombia Coffee] [2008-01-07 14:21:11] [74be16979710d4c4e7c6647856088456] F RMPD [Univariate Data Series] [] [2009-10-14 08:30:28] [74be16979710d4c4e7c6647856088456] - RMP [Kernel Density Estimation] [WS3 part 1 kernal...] [2009-10-18 14:43:08] [e0fc65a5811681d807296d590d5b45de] - D [Kernel Density Estimation] [WS3 Part 2 Yt] [2009-10-18 18:13:13] [e0fc65a5811681d807296d590d5b45de] - D [Kernel Density Estimation] [WS3Part2Yt-Xt] [2009-10-18 19:03:19] [51108381f3361ca8af49c4f74052c840] [Current] - D [Kernel Density Estimation] [WS3Part2Yt/Xt] [2009-10-18 19:39:18] [e0fc65a5811681d807296d590d5b45de] - D [Kernel Density Estimation] [Ws3Part2Yt*Xt] [2009-10-19 19:46:46] [e0fc65a5811681d807296d590d5b45de] | |||||||||||||||||||||||||||||||||||||
| Feedback Forum | |||||||||||||||||||||||||||||||||||||
Post a new message | |||||||||||||||||||||||||||||||||||||
Dataset | |||||||||||||||||||||||||||||||||||||
| Dataseries X: | |||||||||||||||||||||||||||||||||||||
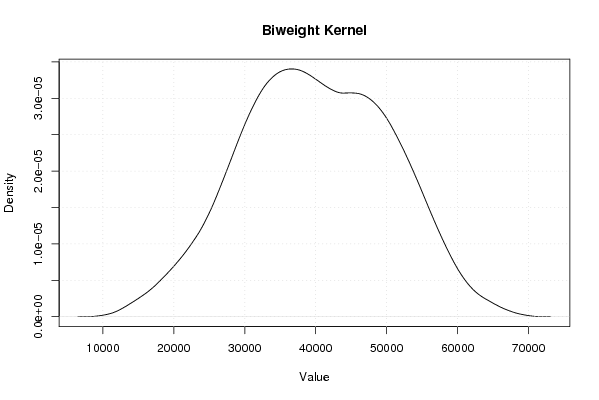
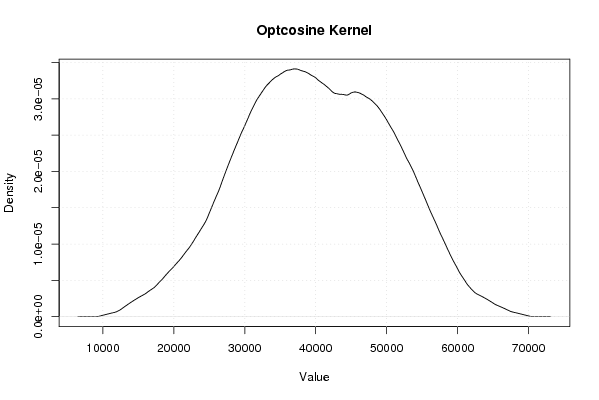
58502,8 46759,8 51272,4 46129,4 47099,8 45275,7 41120,6 33688,1 31187,8 42517,7 33517,7 21430,6 56313,45 53044,13 53427,63 52299,62 41346,08 38162,97 35197,86 26305,7 31808,36 37921,34 27424,96 18277,97 50446,97 43791,46 48462,25 43789,17 37422,35 40247,18 35379,05 28916,88 34374,85 42487,8 30196,01 26340,86 47349,86 49993,19 61354,03 53615,01 39367,27 43785,19 31370,98 29785,82 33731,79 39009,75 33591,64 24983,49 51331,36 45483,05 52406,82 48452,81 41633,31 49473,3 32635,17 33267,23 35533,27 36921,99 35569,14 20859,96 | |||||||||||||||||||||||||||||||||||||
Tables (Output of Computation) | |||||||||||||||||||||||||||||||||||||
| |||||||||||||||||||||||||||||||||||||
Figures (Output of Computation) | |||||||||||||||||||||||||||||||||||||
Input Parameters & R Code | |||||||||||||||||||||||||||||||||||||
| Parameters (Session): | |||||||||||||||||||||||||||||||||||||
| par1 = 0 ; | |||||||||||||||||||||||||||||||||||||
| Parameters (R input): | |||||||||||||||||||||||||||||||||||||
| par1 = 0 ; | |||||||||||||||||||||||||||||||||||||
| R code (references can be found in the software module): | |||||||||||||||||||||||||||||||||||||
if (par1 == '0') bw <- 'nrd0' | |||||||||||||||||||||||||||||||||||||