Free Statistics

of Irreproducible Research!

Author's title

Author*The author of this computation has been verified*
R Software Modulerwasp_centraltendency.wasp
Title produced by softwareCentral Tendency
Date of computationSun, 18 Oct 2009 05:34:36 -0600
Cite this page as followsStatistical Computations at FreeStatistics.org, Office for Research Development and Education, URL https://freestatistics.org/blog/index.php?v=date/2009/Oct/18/t1255865713mihtgfh8uiwj2h5.htm/, Retrieved Mon, 29 Apr 2024 11:34:31 +0000
Statistical Computations at FreeStatistics.org, Office for Research Development and Education, URL https://freestatistics.org/blog/index.php?pk=47278, Retrieved Mon, 29 Apr 2024 11:34:31 +0000
QR Codes:

Original text written by user:
IsPrivate?No (this computation is public)
User-defined keywordsHSWWS3V2C
Estimated Impact98
Family? (F = Feedback message, R = changed R code, M = changed R Module, P = changed Parameters, D = changed Data)
-       [Central Tendency] [] [2009-10-18 11:34:36] [4563e36d4b7005634fe3557528d9fcab] [Current]
Feedback Forum

Post a new message
Dataseries X:
4915
4676
5763
4502
4974
4810
4489
4488
5471
5100
5199
4736
5507
5179
5578
4511
4597
4726
4231
3960
5610
5545
5165
4364
5314
4878
5843
5180
5371
5551
5405
5038
6649
6526
6343
5534
6111
5999
6713
6073
5758
6308
5874
6251
7331
7284
7588
6693
7393
6987
8209
6184
5936
6783
5435
6623
7453
7641
8272
7191
7802
6951
7764
6426
6504
6745
6832
6639
7742
8506
9054
7604


Summary of computational transaction
Raw Inputview raw input (R code)
Raw Outputview raw output of R engine
Computing time1 seconds
R Server'George Udny Yule' @ 72.249.76.132

\begin{tabular}{lllllllll}
\hline
Summary of computational transaction \tabularnewline
Raw Input & view raw input (R code)  \tabularnewline
Raw Output & view raw output of R engine  \tabularnewline
Computing time & 1 seconds \tabularnewline
R Server & 'George Udny Yule' @ 72.249.76.132 \tabularnewline
\hline
\end{tabular}
%Source: https://freestatistics.org/blog/index.php?pk=47278&T=0

[TABLE]
[ROW][C]Summary of computational transaction[/C][/ROW]
[ROW][C]Raw Input[/C][C]view raw input (R code) [/C][/ROW]
[ROW][C]Raw Output[/C][C]view raw output of R engine [/C][/ROW]
[ROW][C]Computing time[/C][C]1 seconds[/C][/ROW]
[ROW][C]R Server[/C][C]'George Udny Yule' @ 72.249.76.132[/C][/ROW]
[/TABLE]
Source: https://freestatistics.org/blog/index.php?pk=47278&T=0

Globally Unique Identifier (entire table): ba.freestatistics.org/blog/index.php?pk=47278&T=0

As an alternative you can also use a QR Code:  

The GUIDs for individual cells are displayed in the table below:

Summary of computational transaction
Raw Inputview raw input (R code)
Raw Outputview raw output of R engine
Computing time1 seconds
R Server'George Udny Yule' @ 72.249.76.132


Central Tendency - Ungrouped Data
MeasureValueS.E.Value/S.E.
Arithmetic Mean6060.93055555556137.66456836376344.0268009960284
Geometric Mean5951.91306929319
Harmonic Mean5845.46712296855
Quadratic Mean6170.93494289516
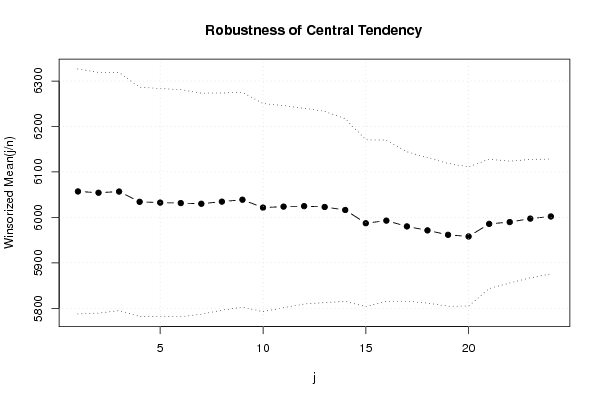
Winsorized Mean ( 1 / 24 )6057.08333333333134.75896402167144.9475356040825
Winsorized Mean ( 2 / 24 )6054.27777777778132.47557902658245.7010856058456
Winsorized Mean ( 3 / 24 )6056.81944444444130.96202266173046.2486705790197
Winsorized Mean ( 4 / 24 )6034.26388888889126.09620583972247.8544445386319
Winsorized Mean ( 5 / 24 )6032.52777777778125.42363108612648.0972184072341
Winsorized Mean ( 6 / 24 )6031.44444444444124.93990556854848.2747639114815
Winsorized Mean ( 7 / 24 )6029.98611111111121.66674945822649.5614959548295
Winsorized Mean ( 8 / 24 )6034.65277777778119.47180991566050.5111020083975
Winsorized Mean ( 9 / 24 )6038.90277777778118.11222508729351.1285158950704
Winsorized Mean ( 10 / 24 )6021.54166666667114.51003833763352.5852733444396
Winsorized Mean ( 11 / 24 )6023.68055555556111.14399228603854.1970864250865
Winsorized Mean ( 12 / 24 )6024.68055555556107.642015641955.9695999710584
Winsorized Mean ( 13 / 24 )6022.875105.20360864211157.2496996798756
Winsorized Mean ( 14 / 24 )6016.26388888889100.49864330217259.8641304121847
Winsorized Mean ( 15 / 24 )5987.0972222222291.783943672138365.2303331354855
Winsorized Mean ( 16 / 24 )5992.87588.578941339277567.6557532681038
Winsorized Mean ( 17 / 24 )5980.12582.223777487484972.7298742861847
Winsorized Mean ( 18 / 24 )5971.37579.965581987635774.6743142683973
Winsorized Mean ( 19 / 24 )5961.6111111111178.507135515822275.9371880268083
Winsorized Mean ( 20 / 24 )595876.526136768843277.855752969693
Winsorized Mean ( 21 / 24 )5985.7083333333371.135196166224284.1455236778473
Winsorized Mean ( 22 / 24 )5989.6805555555666.969379714918889.439092627899
Winsorized Mean ( 23 / 24 )5997.3472222222265.123799162968992.0914826730881
Winsorized Mean ( 24 / 24 )6002.0138888888963.110797858684795.102804789893
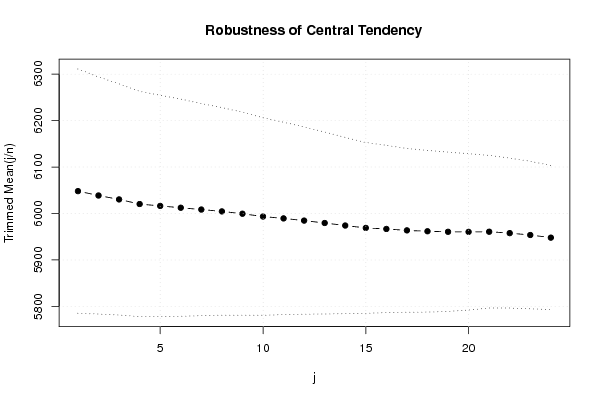
Trimmed Mean ( 1 / 24 )6048.18571428571131.48026057335746.0007128667901
Trimmed Mean ( 2 / 24 )6038.76470588235127.57225589079847.3360344983752
Trimmed Mean ( 3 / 24 )6030.30303030303124.36368759569548.4892587771078
Trimmed Mean ( 4 / 24 )6020.359375121.19076315872349.6767180772279
Trimmed Mean ( 5 / 24 )6016.32258064516119.15718430388050.4906407095193
Trimmed Mean ( 6 / 24 )6012.43333333333116.86829558199751.446231019215
Trimmed Mean ( 7 / 24 )6008.5114.18378974394952.6213047707887
Trimmed Mean ( 8 / 24 )6004.55357142857111.72374591986053.7446495549447
Trimmed Mean ( 9 / 24 )5999.53703703704109.18752009432554.9470949780171
Trimmed Mean ( 10 / 24 )5993.48076923077106.31192362981156.3763740189735
Trimmed Mean ( 11 / 24 )5989.44103.53197341095857.8511140343632
Trimmed Mean ( 12 / 24 )5984.77083333333100.74880214862359.4028981555998
Trimmed Mean ( 13 / 24 )5979.565217391397.951489779004861.0461896075518
Trimmed Mean ( 14 / 24 )5974.1136363636494.858430266981262.9792588760889
Trimmed Mean ( 15 / 24 )5968.9523809523891.896674495071664.9528659633107
Trimmed Mean ( 16 / 24 )5966.77590.010700841764666.2896182809349
Trimmed Mean ( 17 / 24 )5963.6842105263288.12349172675567.6741705721097
Trimmed Mean ( 18 / 24 )5961.7586.953010253029768.5628937129554
Trimmed Mean ( 19 / 24 )5960.6176470588285.694437206292369.556646164906
Trimmed Mean ( 20 / 24 )5960.584.09161190956270.8810292090766
Trimmed Mean ( 21 / 24 )5960.882.131705275698872.5761139378618
Trimmed Mean ( 22 / 24 )5957.7580.622243195557473.8971004012984
Trimmed Mean ( 23 / 24 )5953.7307692307779.33800248968575.0426098767087
Trimmed Mean ( 24 / 24 )5948.0416666666777.552704826886576.6967661533394
Median5905
Midrange6507
Midmean - Weighted Average at Xnp5940.21621621622
Midmean - Weighted Average at X(n+1)p5961.75
Midmean - Empirical Distribution Function5940.21621621622
Midmean - Empirical Distribution Function - Averaging5961.75
Midmean - Empirical Distribution Function - Interpolation5961.75
Midmean - Closest Observation5940.21621621622
Midmean - True Basic - Statistics Graphics Toolkit5961.75
Midmean - MS Excel (old versions)5963.68421052632
Number of observations72

\begin{tabular}{lllllllll}
\hline
Central Tendency - Ungrouped Data \tabularnewline
Measure & Value & S.E. & Value/S.E. \tabularnewline
Arithmetic Mean & 6060.93055555556 & 137.664568363763 & 44.0268009960284 \tabularnewline
Geometric Mean & 5951.91306929319 &  &  \tabularnewline
Harmonic Mean & 5845.46712296855 &  &  \tabularnewline
Quadratic Mean & 6170.93494289516 &  &  \tabularnewline
Winsorized Mean ( 1 / 24 ) & 6057.08333333333 & 134.758964021671 & 44.9475356040825 \tabularnewline
Winsorized Mean ( 2 / 24 ) & 6054.27777777778 & 132.475579026582 & 45.7010856058456 \tabularnewline
Winsorized Mean ( 3 / 24 ) & 6056.81944444444 & 130.962022661730 & 46.2486705790197 \tabularnewline
Winsorized Mean ( 4 / 24 ) & 6034.26388888889 & 126.096205839722 & 47.8544445386319 \tabularnewline
Winsorized Mean ( 5 / 24 ) & 6032.52777777778 & 125.423631086126 & 48.0972184072341 \tabularnewline
Winsorized Mean ( 6 / 24 ) & 6031.44444444444 & 124.939905568548 & 48.2747639114815 \tabularnewline
Winsorized Mean ( 7 / 24 ) & 6029.98611111111 & 121.666749458226 & 49.5614959548295 \tabularnewline
Winsorized Mean ( 8 / 24 ) & 6034.65277777778 & 119.471809915660 & 50.5111020083975 \tabularnewline
Winsorized Mean ( 9 / 24 ) & 6038.90277777778 & 118.112225087293 & 51.1285158950704 \tabularnewline
Winsorized Mean ( 10 / 24 ) & 6021.54166666667 & 114.510038337633 & 52.5852733444396 \tabularnewline
Winsorized Mean ( 11 / 24 ) & 6023.68055555556 & 111.143992286038 & 54.1970864250865 \tabularnewline
Winsorized Mean ( 12 / 24 ) & 6024.68055555556 & 107.6420156419 & 55.9695999710584 \tabularnewline
Winsorized Mean ( 13 / 24 ) & 6022.875 & 105.203608642111 & 57.2496996798756 \tabularnewline
Winsorized Mean ( 14 / 24 ) & 6016.26388888889 & 100.498643302172 & 59.8641304121847 \tabularnewline
Winsorized Mean ( 15 / 24 ) & 5987.09722222222 & 91.7839436721383 & 65.2303331354855 \tabularnewline
Winsorized Mean ( 16 / 24 ) & 5992.875 & 88.5789413392775 & 67.6557532681038 \tabularnewline
Winsorized Mean ( 17 / 24 ) & 5980.125 & 82.2237774874849 & 72.7298742861847 \tabularnewline
Winsorized Mean ( 18 / 24 ) & 5971.375 & 79.9655819876357 & 74.6743142683973 \tabularnewline
Winsorized Mean ( 19 / 24 ) & 5961.61111111111 & 78.5071355158222 & 75.9371880268083 \tabularnewline
Winsorized Mean ( 20 / 24 ) & 5958 & 76.5261367688432 & 77.855752969693 \tabularnewline
Winsorized Mean ( 21 / 24 ) & 5985.70833333333 & 71.1351961662242 & 84.1455236778473 \tabularnewline
Winsorized Mean ( 22 / 24 ) & 5989.68055555556 & 66.9693797149188 & 89.439092627899 \tabularnewline
Winsorized Mean ( 23 / 24 ) & 5997.34722222222 & 65.1237991629689 & 92.0914826730881 \tabularnewline
Winsorized Mean ( 24 / 24 ) & 6002.01388888889 & 63.1107978586847 & 95.102804789893 \tabularnewline
Trimmed Mean ( 1 / 24 ) & 6048.18571428571 & 131.480260573357 & 46.0007128667901 \tabularnewline
Trimmed Mean ( 2 / 24 ) & 6038.76470588235 & 127.572255890798 & 47.3360344983752 \tabularnewline
Trimmed Mean ( 3 / 24 ) & 6030.30303030303 & 124.363687595695 & 48.4892587771078 \tabularnewline
Trimmed Mean ( 4 / 24 ) & 6020.359375 & 121.190763158723 & 49.6767180772279 \tabularnewline
Trimmed Mean ( 5 / 24 ) & 6016.32258064516 & 119.157184303880 & 50.4906407095193 \tabularnewline
Trimmed Mean ( 6 / 24 ) & 6012.43333333333 & 116.868295581997 & 51.446231019215 \tabularnewline
Trimmed Mean ( 7 / 24 ) & 6008.5 & 114.183789743949 & 52.6213047707887 \tabularnewline
Trimmed Mean ( 8 / 24 ) & 6004.55357142857 & 111.723745919860 & 53.7446495549447 \tabularnewline
Trimmed Mean ( 9 / 24 ) & 5999.53703703704 & 109.187520094325 & 54.9470949780171 \tabularnewline
Trimmed Mean ( 10 / 24 ) & 5993.48076923077 & 106.311923629811 & 56.3763740189735 \tabularnewline
Trimmed Mean ( 11 / 24 ) & 5989.44 & 103.531973410958 & 57.8511140343632 \tabularnewline
Trimmed Mean ( 12 / 24 ) & 5984.77083333333 & 100.748802148623 & 59.4028981555998 \tabularnewline
Trimmed Mean ( 13 / 24 ) & 5979.5652173913 & 97.9514897790048 & 61.0461896075518 \tabularnewline
Trimmed Mean ( 14 / 24 ) & 5974.11363636364 & 94.8584302669812 & 62.9792588760889 \tabularnewline
Trimmed Mean ( 15 / 24 ) & 5968.95238095238 & 91.8966744950716 & 64.9528659633107 \tabularnewline
Trimmed Mean ( 16 / 24 ) & 5966.775 & 90.0107008417646 & 66.2896182809349 \tabularnewline
Trimmed Mean ( 17 / 24 ) & 5963.68421052632 & 88.123491726755 & 67.6741705721097 \tabularnewline
Trimmed Mean ( 18 / 24 ) & 5961.75 & 86.9530102530297 & 68.5628937129554 \tabularnewline
Trimmed Mean ( 19 / 24 ) & 5960.61764705882 & 85.6944372062923 & 69.556646164906 \tabularnewline
Trimmed Mean ( 20 / 24 ) & 5960.5 & 84.091611909562 & 70.8810292090766 \tabularnewline
Trimmed Mean ( 21 / 24 ) & 5960.8 & 82.1317052756988 & 72.5761139378618 \tabularnewline
Trimmed Mean ( 22 / 24 ) & 5957.75 & 80.6222431955574 & 73.8971004012984 \tabularnewline
Trimmed Mean ( 23 / 24 ) & 5953.73076923077 & 79.338002489685 & 75.0426098767087 \tabularnewline
Trimmed Mean ( 24 / 24 ) & 5948.04166666667 & 77.5527048268865 & 76.6967661533394 \tabularnewline
Median & 5905 &  &  \tabularnewline
Midrange & 6507 &  &  \tabularnewline
Midmean - Weighted Average at Xnp & 5940.21621621622 &  &  \tabularnewline
Midmean - Weighted Average at X(n+1)p & 5961.75 &  &  \tabularnewline
Midmean - Empirical Distribution Function & 5940.21621621622 &  &  \tabularnewline
Midmean - Empirical Distribution Function - Averaging & 5961.75 &  &  \tabularnewline
Midmean - Empirical Distribution Function - Interpolation & 5961.75 &  &  \tabularnewline
Midmean - Closest Observation & 5940.21621621622 &  &  \tabularnewline
Midmean - True Basic - Statistics Graphics Toolkit & 5961.75 &  &  \tabularnewline
Midmean - MS Excel (old versions) & 5963.68421052632 &  &  \tabularnewline
Number of observations & 72 &  &  \tabularnewline
\hline
\end{tabular}
%Source: https://freestatistics.org/blog/index.php?pk=47278&T=1

[TABLE]
[ROW][C]Central Tendency - Ungrouped Data[/C][/ROW]
[ROW][C]Measure[/C][C]Value[/C][C]S.E.[/C][C]Value/S.E.[/C][/ROW]
[ROW][C]Arithmetic Mean[/C][C]6060.93055555556[/C][C]137.664568363763[/C][C]44.0268009960284[/C][/ROW]
[ROW][C]Geometric Mean[/C][C]5951.91306929319[/C][C][/C][C][/C][/ROW]
[ROW][C]Harmonic Mean[/C][C]5845.46712296855[/C][C][/C][C][/C][/ROW]
[ROW][C]Quadratic Mean[/C][C]6170.93494289516[/C][C][/C][C][/C][/ROW]
[ROW][C]Winsorized Mean ( 1 / 24 )[/C][C]6057.08333333333[/C][C]134.758964021671[/C][C]44.9475356040825[/C][/ROW]
[ROW][C]Winsorized Mean ( 2 / 24 )[/C][C]6054.27777777778[/C][C]132.475579026582[/C][C]45.7010856058456[/C][/ROW]
[ROW][C]Winsorized Mean ( 3 / 24 )[/C][C]6056.81944444444[/C][C]130.962022661730[/C][C]46.2486705790197[/C][/ROW]
[ROW][C]Winsorized Mean ( 4 / 24 )[/C][C]6034.26388888889[/C][C]126.096205839722[/C][C]47.8544445386319[/C][/ROW]
[ROW][C]Winsorized Mean ( 5 / 24 )[/C][C]6032.52777777778[/C][C]125.423631086126[/C][C]48.0972184072341[/C][/ROW]
[ROW][C]Winsorized Mean ( 6 / 24 )[/C][C]6031.44444444444[/C][C]124.939905568548[/C][C]48.2747639114815[/C][/ROW]
[ROW][C]Winsorized Mean ( 7 / 24 )[/C][C]6029.98611111111[/C][C]121.666749458226[/C][C]49.5614959548295[/C][/ROW]
[ROW][C]Winsorized Mean ( 8 / 24 )[/C][C]6034.65277777778[/C][C]119.471809915660[/C][C]50.5111020083975[/C][/ROW]
[ROW][C]Winsorized Mean ( 9 / 24 )[/C][C]6038.90277777778[/C][C]118.112225087293[/C][C]51.1285158950704[/C][/ROW]
[ROW][C]Winsorized Mean ( 10 / 24 )[/C][C]6021.54166666667[/C][C]114.510038337633[/C][C]52.5852733444396[/C][/ROW]
[ROW][C]Winsorized Mean ( 11 / 24 )[/C][C]6023.68055555556[/C][C]111.143992286038[/C][C]54.1970864250865[/C][/ROW]
[ROW][C]Winsorized Mean ( 12 / 24 )[/C][C]6024.68055555556[/C][C]107.6420156419[/C][C]55.9695999710584[/C][/ROW]
[ROW][C]Winsorized Mean ( 13 / 24 )[/C][C]6022.875[/C][C]105.203608642111[/C][C]57.2496996798756[/C][/ROW]
[ROW][C]Winsorized Mean ( 14 / 24 )[/C][C]6016.26388888889[/C][C]100.498643302172[/C][C]59.8641304121847[/C][/ROW]
[ROW][C]Winsorized Mean ( 15 / 24 )[/C][C]5987.09722222222[/C][C]91.7839436721383[/C][C]65.2303331354855[/C][/ROW]
[ROW][C]Winsorized Mean ( 16 / 24 )[/C][C]5992.875[/C][C]88.5789413392775[/C][C]67.6557532681038[/C][/ROW]
[ROW][C]Winsorized Mean ( 17 / 24 )[/C][C]5980.125[/C][C]82.2237774874849[/C][C]72.7298742861847[/C][/ROW]
[ROW][C]Winsorized Mean ( 18 / 24 )[/C][C]5971.375[/C][C]79.9655819876357[/C][C]74.6743142683973[/C][/ROW]
[ROW][C]Winsorized Mean ( 19 / 24 )[/C][C]5961.61111111111[/C][C]78.5071355158222[/C][C]75.9371880268083[/C][/ROW]
[ROW][C]Winsorized Mean ( 20 / 24 )[/C][C]5958[/C][C]76.5261367688432[/C][C]77.855752969693[/C][/ROW]
[ROW][C]Winsorized Mean ( 21 / 24 )[/C][C]5985.70833333333[/C][C]71.1351961662242[/C][C]84.1455236778473[/C][/ROW]
[ROW][C]Winsorized Mean ( 22 / 24 )[/C][C]5989.68055555556[/C][C]66.9693797149188[/C][C]89.439092627899[/C][/ROW]
[ROW][C]Winsorized Mean ( 23 / 24 )[/C][C]5997.34722222222[/C][C]65.1237991629689[/C][C]92.0914826730881[/C][/ROW]
[ROW][C]Winsorized Mean ( 24 / 24 )[/C][C]6002.01388888889[/C][C]63.1107978586847[/C][C]95.102804789893[/C][/ROW]
[ROW][C]Trimmed Mean ( 1 / 24 )[/C][C]6048.18571428571[/C][C]131.480260573357[/C][C]46.0007128667901[/C][/ROW]
[ROW][C]Trimmed Mean ( 2 / 24 )[/C][C]6038.76470588235[/C][C]127.572255890798[/C][C]47.3360344983752[/C][/ROW]
[ROW][C]Trimmed Mean ( 3 / 24 )[/C][C]6030.30303030303[/C][C]124.363687595695[/C][C]48.4892587771078[/C][/ROW]
[ROW][C]Trimmed Mean ( 4 / 24 )[/C][C]6020.359375[/C][C]121.190763158723[/C][C]49.6767180772279[/C][/ROW]
[ROW][C]Trimmed Mean ( 5 / 24 )[/C][C]6016.32258064516[/C][C]119.157184303880[/C][C]50.4906407095193[/C][/ROW]
[ROW][C]Trimmed Mean ( 6 / 24 )[/C][C]6012.43333333333[/C][C]116.868295581997[/C][C]51.446231019215[/C][/ROW]
[ROW][C]Trimmed Mean ( 7 / 24 )[/C][C]6008.5[/C][C]114.183789743949[/C][C]52.6213047707887[/C][/ROW]
[ROW][C]Trimmed Mean ( 8 / 24 )[/C][C]6004.55357142857[/C][C]111.723745919860[/C][C]53.7446495549447[/C][/ROW]
[ROW][C]Trimmed Mean ( 9 / 24 )[/C][C]5999.53703703704[/C][C]109.187520094325[/C][C]54.9470949780171[/C][/ROW]
[ROW][C]Trimmed Mean ( 10 / 24 )[/C][C]5993.48076923077[/C][C]106.311923629811[/C][C]56.3763740189735[/C][/ROW]
[ROW][C]Trimmed Mean ( 11 / 24 )[/C][C]5989.44[/C][C]103.531973410958[/C][C]57.8511140343632[/C][/ROW]
[ROW][C]Trimmed Mean ( 12 / 24 )[/C][C]5984.77083333333[/C][C]100.748802148623[/C][C]59.4028981555998[/C][/ROW]
[ROW][C]Trimmed Mean ( 13 / 24 )[/C][C]5979.5652173913[/C][C]97.9514897790048[/C][C]61.0461896075518[/C][/ROW]
[ROW][C]Trimmed Mean ( 14 / 24 )[/C][C]5974.11363636364[/C][C]94.8584302669812[/C][C]62.9792588760889[/C][/ROW]
[ROW][C]Trimmed Mean ( 15 / 24 )[/C][C]5968.95238095238[/C][C]91.8966744950716[/C][C]64.9528659633107[/C][/ROW]
[ROW][C]Trimmed Mean ( 16 / 24 )[/C][C]5966.775[/C][C]90.0107008417646[/C][C]66.2896182809349[/C][/ROW]
[ROW][C]Trimmed Mean ( 17 / 24 )[/C][C]5963.68421052632[/C][C]88.123491726755[/C][C]67.6741705721097[/C][/ROW]
[ROW][C]Trimmed Mean ( 18 / 24 )[/C][C]5961.75[/C][C]86.9530102530297[/C][C]68.5628937129554[/C][/ROW]
[ROW][C]Trimmed Mean ( 19 / 24 )[/C][C]5960.61764705882[/C][C]85.6944372062923[/C][C]69.556646164906[/C][/ROW]
[ROW][C]Trimmed Mean ( 20 / 24 )[/C][C]5960.5[/C][C]84.091611909562[/C][C]70.8810292090766[/C][/ROW]
[ROW][C]Trimmed Mean ( 21 / 24 )[/C][C]5960.8[/C][C]82.1317052756988[/C][C]72.5761139378618[/C][/ROW]
[ROW][C]Trimmed Mean ( 22 / 24 )[/C][C]5957.75[/C][C]80.6222431955574[/C][C]73.8971004012984[/C][/ROW]
[ROW][C]Trimmed Mean ( 23 / 24 )[/C][C]5953.73076923077[/C][C]79.338002489685[/C][C]75.0426098767087[/C][/ROW]
[ROW][C]Trimmed Mean ( 24 / 24 )[/C][C]5948.04166666667[/C][C]77.5527048268865[/C][C]76.6967661533394[/C][/ROW]
[ROW][C]Median[/C][C]5905[/C][C][/C][C][/C][/ROW]
[ROW][C]Midrange[/C][C]6507[/C][C][/C][C][/C][/ROW]
[ROW][C]Midmean - Weighted Average at Xnp[/C][C]5940.21621621622[/C][C][/C][C][/C][/ROW]
[ROW][C]Midmean - Weighted Average at X(n+1)p[/C][C]5961.75[/C][C][/C][C][/C][/ROW]
[ROW][C]Midmean - Empirical Distribution Function[/C][C]5940.21621621622[/C][C][/C][C][/C][/ROW]
[ROW][C]Midmean - Empirical Distribution Function - Averaging[/C][C]5961.75[/C][C][/C][C][/C][/ROW]
[ROW][C]Midmean - Empirical Distribution Function - Interpolation[/C][C]5961.75[/C][C][/C][C][/C][/ROW]
[ROW][C]Midmean - Closest Observation[/C][C]5940.21621621622[/C][C][/C][C][/C][/ROW]
[ROW][C]Midmean - True Basic - Statistics Graphics Toolkit[/C][C]5961.75[/C][C][/C][C][/C][/ROW]
[ROW][C]Midmean - MS Excel (old versions)[/C][C]5963.68421052632[/C][C][/C][C][/C][/ROW]
[ROW][C]Number of observations[/C][C]72[/C][C][/C][C][/C][/ROW]
[/TABLE]
Source: https://freestatistics.org/blog/index.php?pk=47278&T=1

Globally Unique Identifier (entire table): ba.freestatistics.org/blog/index.php?pk=47278&T=1

As an alternative you can also use a QR Code:  

The GUIDs for individual cells are displayed in the table below:

Central Tendency - Ungrouped Data
MeasureValueS.E.Value/S.E.
Arithmetic Mean6060.93055555556137.66456836376344.0268009960284
Geometric Mean5951.91306929319
Harmonic Mean5845.46712296855
Quadratic Mean6170.93494289516
Winsorized Mean ( 1 / 24 )6057.08333333333134.75896402167144.9475356040825
Winsorized Mean ( 2 / 24 )6054.27777777778132.47557902658245.7010856058456
Winsorized Mean ( 3 / 24 )6056.81944444444130.96202266173046.2486705790197
Winsorized Mean ( 4 / 24 )6034.26388888889126.09620583972247.8544445386319
Winsorized Mean ( 5 / 24 )6032.52777777778125.42363108612648.0972184072341
Winsorized Mean ( 6 / 24 )6031.44444444444124.93990556854848.2747639114815
Winsorized Mean ( 7 / 24 )6029.98611111111121.66674945822649.5614959548295
Winsorized Mean ( 8 / 24 )6034.65277777778119.47180991566050.5111020083975
Winsorized Mean ( 9 / 24 )6038.90277777778118.11222508729351.1285158950704
Winsorized Mean ( 10 / 24 )6021.54166666667114.51003833763352.5852733444396
Winsorized Mean ( 11 / 24 )6023.68055555556111.14399228603854.1970864250865
Winsorized Mean ( 12 / 24 )6024.68055555556107.642015641955.9695999710584
Winsorized Mean ( 13 / 24 )6022.875105.20360864211157.2496996798756
Winsorized Mean ( 14 / 24 )6016.26388888889100.49864330217259.8641304121847
Winsorized Mean ( 15 / 24 )5987.0972222222291.783943672138365.2303331354855
Winsorized Mean ( 16 / 24 )5992.87588.578941339277567.6557532681038
Winsorized Mean ( 17 / 24 )5980.12582.223777487484972.7298742861847
Winsorized Mean ( 18 / 24 )5971.37579.965581987635774.6743142683973
Winsorized Mean ( 19 / 24 )5961.6111111111178.507135515822275.9371880268083
Winsorized Mean ( 20 / 24 )595876.526136768843277.855752969693
Winsorized Mean ( 21 / 24 )5985.7083333333371.135196166224284.1455236778473
Winsorized Mean ( 22 / 24 )5989.6805555555666.969379714918889.439092627899
Winsorized Mean ( 23 / 24 )5997.3472222222265.123799162968992.0914826730881
Winsorized Mean ( 24 / 24 )6002.0138888888963.110797858684795.102804789893
Trimmed Mean ( 1 / 24 )6048.18571428571131.48026057335746.0007128667901
Trimmed Mean ( 2 / 24 )6038.76470588235127.57225589079847.3360344983752
Trimmed Mean ( 3 / 24 )6030.30303030303124.36368759569548.4892587771078
Trimmed Mean ( 4 / 24 )6020.359375121.19076315872349.6767180772279
Trimmed Mean ( 5 / 24 )6016.32258064516119.15718430388050.4906407095193
Trimmed Mean ( 6 / 24 )6012.43333333333116.86829558199751.446231019215
Trimmed Mean ( 7 / 24 )6008.5114.18378974394952.6213047707887
Trimmed Mean ( 8 / 24 )6004.55357142857111.72374591986053.7446495549447
Trimmed Mean ( 9 / 24 )5999.53703703704109.18752009432554.9470949780171
Trimmed Mean ( 10 / 24 )5993.48076923077106.31192362981156.3763740189735
Trimmed Mean ( 11 / 24 )5989.44103.53197341095857.8511140343632
Trimmed Mean ( 12 / 24 )5984.77083333333100.74880214862359.4028981555998
Trimmed Mean ( 13 / 24 )5979.565217391397.951489779004861.0461896075518
Trimmed Mean ( 14 / 24 )5974.1136363636494.858430266981262.9792588760889
Trimmed Mean ( 15 / 24 )5968.9523809523891.896674495071664.9528659633107
Trimmed Mean ( 16 / 24 )5966.77590.010700841764666.2896182809349
Trimmed Mean ( 17 / 24 )5963.6842105263288.12349172675567.6741705721097
Trimmed Mean ( 18 / 24 )5961.7586.953010253029768.5628937129554
Trimmed Mean ( 19 / 24 )5960.6176470588285.694437206292369.556646164906
Trimmed Mean ( 20 / 24 )5960.584.09161190956270.8810292090766
Trimmed Mean ( 21 / 24 )5960.882.131705275698872.5761139378618
Trimmed Mean ( 22 / 24 )5957.7580.622243195557473.8971004012984
Trimmed Mean ( 23 / 24 )5953.7307692307779.33800248968575.0426098767087
Trimmed Mean ( 24 / 24 )5948.0416666666777.552704826886576.6967661533394
Median5905
Midrange6507
Midmean - Weighted Average at Xnp5940.21621621622
Midmean - Weighted Average at X(n+1)p5961.75
Midmean - Empirical Distribution Function5940.21621621622
Midmean - Empirical Distribution Function - Averaging5961.75
Midmean - Empirical Distribution Function - Interpolation5961.75
Midmean - Closest Observation5940.21621621622
Midmean - True Basic - Statistics Graphics Toolkit5961.75
Midmean - MS Excel (old versions)5963.68421052632
Number of observations72


Parameters (Session):
Parameters (R input):
R code (references can be found in the software module):
geomean <- function(x) {
return(exp(mean(log(x))))
}
harmean <- function(x) {
return(1/mean(1/x))
}
quamean <- function(x) {
return(sqrt(mean(x*x)))
}
winmean <- function(x) {
x <-sort(x[!is.na(x)])
n<-length(x)
denom <- 3
nodenom <- n/denom
if (nodenom>40) denom <- n/40
sqrtn = sqrt(n)
roundnodenom = floor(nodenom)
win <- array(NA,dim=c(roundnodenom,2))
for (j in 1:roundnodenom) {
win[j,1] <- (j*x[j+1]+sum(x[(j+1):(n-j)])+j*x[n-j])/n
win[j,2] <- sd(c(rep(x[j+1],j),x[(j+1):(n-j)],rep(x[n-j],j)))/sqrtn
}
return(win)
}
trimean <- function(x) {
x <-sort(x[!is.na(x)])
n<-length(x)
denom <- 3
nodenom <- n/denom
if (nodenom>40) denom <- n/40
sqrtn = sqrt(n)
roundnodenom = floor(nodenom)
tri <- array(NA,dim=c(roundnodenom,2))
for (j in 1:roundnodenom) {
tri[j,1] <- mean(x,trim=j/n)
tri[j,2] <- sd(x[(j+1):(n-j)]) / sqrt(n-j*2)
}
return(tri)
}
midrange <- function(x) {
return((max(x)+min(x))/2)
}
q1 <- function(data,n,p,i,f) {
np <- n*p;
i <<- floor(np)
f <<- np - i
qvalue <- (1-f)*data[i] + f*data[i+1]
}
q2 <- function(data,n,p,i,f) {
np <- (n+1)*p
i <<- floor(np)
f <<- np - i
qvalue <- (1-f)*data[i] + f*data[i+1]
}
q3 <- function(data,n,p,i,f) {
np <- n*p
i <<- floor(np)
f <<- np - i
if (f==0) {
qvalue <- data[i]
} else {
qvalue <- data[i+1]
}
}
q4 <- function(data,n,p,i,f) {
np <- n*p
i <<- floor(np)
f <<- np - i
if (f==0) {
qvalue <- (data[i]+data[i+1])/2
} else {
qvalue <- data[i+1]
}
}
q5 <- function(data,n,p,i,f) {
np <- (n-1)*p
i <<- floor(np)
f <<- np - i
if (f==0) {
qvalue <- data[i+1]
} else {
qvalue <- data[i+1] + f*(data[i+2]-data[i+1])
}
}
q6 <- function(data,n,p,i,f) {
np <- n*p+0.5
i <<- floor(np)
f <<- np - i
qvalue <- data[i]
}
q7 <- function(data,n,p,i,f) {
np <- (n+1)*p
i <<- floor(np)
f <<- np - i
if (f==0) {
qvalue <- data[i]
} else {
qvalue <- f*data[i] + (1-f)*data[i+1]
}
}
q8 <- function(data,n,p,i,f) {
np <- (n+1)*p
i <<- floor(np)
f <<- np - i
if (f==0) {
qvalue <- data[i]
} else {
if (f == 0.5) {
qvalue <- (data[i]+data[i+1])/2
} else {
if (f < 0.5) {
qvalue <- data[i]
} else {
qvalue <- data[i+1]
}
}
}
}
midmean <- function(x,def) {
x <-sort(x[!is.na(x)])
n<-length(x)
if (def==1) {
qvalue1 <- q1(x,n,0.25,i,f)
qvalue3 <- q1(x,n,0.75,i,f)
}
if (def==2) {
qvalue1 <- q2(x,n,0.25,i,f)
qvalue3 <- q2(x,n,0.75,i,f)
}
if (def==3) {
qvalue1 <- q3(x,n,0.25,i,f)
qvalue3 <- q3(x,n,0.75,i,f)
}
if (def==4) {
qvalue1 <- q4(x,n,0.25,i,f)
qvalue3 <- q4(x,n,0.75,i,f)
}
if (def==5) {
qvalue1 <- q5(x,n,0.25,i,f)
qvalue3 <- q5(x,n,0.75,i,f)
}
if (def==6) {
qvalue1 <- q6(x,n,0.25,i,f)
qvalue3 <- q6(x,n,0.75,i,f)
}
if (def==7) {
qvalue1 <- q7(x,n,0.25,i,f)
qvalue3 <- q7(x,n,0.75,i,f)
}
if (def==8) {
qvalue1 <- q8(x,n,0.25,i,f)
qvalue3 <- q8(x,n,0.75,i,f)
}
midm <- 0
myn <- 0
roundno4 <- round(n/4)
round3no4 <- round(3*n/4)
for (i in 1:n) {
if ((x[i]>=qvalue1) & (x[i]<=qvalue3)){
midm = midm + x[i]
myn = myn + 1
}
}
midm = midm / myn
return(midm)
}
(arm <- mean(x))
sqrtn <- sqrt(length(x))
(armse <- sd(x) / sqrtn)
(armose <- arm / armse)
(geo <- geomean(x))
(har <- harmean(x))
(qua <- quamean(x))
(win <- winmean(x))
(tri <- trimean(x))
(midr <- midrange(x))
midm <- array(NA,dim=8)
for (j in 1:8) midm[j] <- midmean(x,j)
midm
bitmap(file='test1.png')
lb <- win[,1] - 2*win[,2]
ub <- win[,1] + 2*win[,2]
if ((ylimmin == '') | (ylimmax == '')) plot(win[,1],type='b',main=main, xlab='j', pch=19, ylab='Winsorized Mean(j/n)', ylim=c(min(lb),max(ub))) else plot(win[,1],type='l',main=main, xlab='j', pch=19, ylab='Winsorized Mean(j/n)', ylim=c(ylimmin,ylimmax))
lines(ub,lty=3)
lines(lb,lty=3)
grid()
dev.off()
bitmap(file='test2.png')
lb <- tri[,1] - 2*tri[,2]
ub <- tri[,1] + 2*tri[,2]
if ((ylimmin == '') | (ylimmax == '')) plot(tri[,1],type='b',main=main, xlab='j', pch=19, ylab='Trimmed Mean(j/n)', ylim=c(min(lb),max(ub))) else plot(tri[,1],type='l',main=main, xlab='j', pch=19, ylab='Trimmed Mean(j/n)', ylim=c(ylimmin,ylimmax))
lines(ub,lty=3)
lines(lb,lty=3)
grid()
dev.off()
load(file='createtable')
a<-table.start()
a<-table.row.start(a)
a<-table.element(a,'Central Tendency - Ungrouped Data',4,TRUE)
a<-table.row.end(a)
a<-table.row.start(a)
a<-table.element(a,'Measure',header=TRUE)
a<-table.element(a,'Value',header=TRUE)
a<-table.element(a,'S.E.',header=TRUE)
a<-table.element(a,'Value/S.E.',header=TRUE)
a<-table.row.end(a)
a<-table.row.start(a)
a<-table.element(a,hyperlink('arithmetic_mean.htm', 'Arithmetic Mean', 'click to view the definition of the Arithmetic Mean'),header=TRUE)
a<-table.element(a,arm)
a<-table.element(a,hyperlink('arithmetic_mean_standard_error.htm', armse, 'click to view the definition of the Standard Error of the Arithmetic Mean'))
a<-table.element(a,armose)
a<-table.row.end(a)
a<-table.row.start(a)
a<-table.element(a,hyperlink('geometric_mean.htm', 'Geometric Mean', 'click to view the definition of the Geometric Mean'),header=TRUE)
a<-table.element(a,geo)
a<-table.element(a,'')
a<-table.row.end(a)
a<-table.row.start(a)
a<-table.element(a,hyperlink('harmonic_mean.htm', 'Harmonic Mean', 'click to view the definition of the Harmonic Mean'),header=TRUE)
a<-table.element(a,har)
a<-table.element(a,'')
a<-table.row.end(a)
a<-table.row.start(a)
a<-table.element(a,hyperlink('quadratic_mean.htm', 'Quadratic Mean', 'click to view the definition of the Quadratic Mean'),header=TRUE)
a<-table.element(a,qua)
a<-table.element(a,'')
a<-table.row.end(a)
for (j in 1:length(win[,1])) {
a<-table.row.start(a)
mylabel <- paste('Winsorized Mean (',j)
mylabel <- paste(mylabel,'/')
mylabel <- paste(mylabel,length(win[,1]))
mylabel <- paste(mylabel,')')
a<-table.element(a,hyperlink('winsorized_mean.htm', mylabel, 'click to view the definition of the Winsorized Mean'),header=TRUE)
a<-table.element(a,win[j,1])
a<-table.element(a,win[j,2])
a<-table.element(a,win[j,1]/win[j,2])
a<-table.row.end(a)
}
for (j in 1:length(tri[,1])) {
a<-table.row.start(a)
mylabel <- paste('Trimmed Mean (',j)
mylabel <- paste(mylabel,'/')
mylabel <- paste(mylabel,length(tri[,1]))
mylabel <- paste(mylabel,')')
a<-table.element(a,hyperlink('arithmetic_mean.htm', mylabel, 'click to view the definition of the Trimmed Mean'),header=TRUE)
a<-table.element(a,tri[j,1])
a<-table.element(a,tri[j,2])
a<-table.element(a,tri[j,1]/tri[j,2])
a<-table.row.end(a)
}
a<-table.row.start(a)
a<-table.element(a,hyperlink('median_1.htm', 'Median', 'click to view the definition of the Median'),header=TRUE)
a<-table.element(a,median(x))
a<-table.element(a,'')
a<-table.row.end(a)
a<-table.row.start(a)
a<-table.element(a,hyperlink('midrange.htm', 'Midrange', 'click to view the definition of the Midrange'),header=TRUE)
a<-table.element(a,midr)
a<-table.element(a,'')
a<-table.row.end(a)
a<-table.row.start(a)
mymid <- hyperlink('midmean.htm', 'Midmean', 'click to view the definition of the Midmean')
mylabel <- paste(mymid,hyperlink('method_1.htm','Weighted Average at Xnp',''),sep=' - ')
a<-table.element(a,mylabel,header=TRUE)
a<-table.element(a,midm[1])
a<-table.element(a,'')
a<-table.row.end(a)
a<-table.row.start(a)
mymid <- hyperlink('midmean.htm', 'Midmean', 'click to view the definition of the Midmean')
mylabel <- paste(mymid,hyperlink('method_2.htm','Weighted Average at X(n+1)p',''),sep=' - ')
a<-table.element(a,mylabel,header=TRUE)
a<-table.element(a,midm[2])
a<-table.element(a,'')
a<-table.row.end(a)
a<-table.row.start(a)
mymid <- hyperlink('midmean.htm', 'Midmean', 'click to view the definition of the Midmean')
mylabel <- paste(mymid,hyperlink('method_3.htm','Empirical Distribution Function',''),sep=' - ')
a<-table.element(a,mylabel,header=TRUE)
a<-table.element(a,midm[3])
a<-table.element(a,'')
a<-table.row.end(a)
a<-table.row.start(a)
mymid <- hyperlink('midmean.htm', 'Midmean', 'click to view the definition of the Midmean')
mylabel <- paste(mymid,hyperlink('method_4.htm','Empirical Distribution Function - Averaging',''),sep=' - ')
a<-table.element(a,mylabel,header=TRUE)
a<-table.element(a,midm[4])
a<-table.element(a,'')
a<-table.row.end(a)
a<-table.row.start(a)
mymid <- hyperlink('midmean.htm', 'Midmean', 'click to view the definition of the Midmean')
mylabel <- paste(mymid,hyperlink('method_5.htm','Empirical Distribution Function - Interpolation',''),sep=' - ')
a<-table.element(a,mylabel,header=TRUE)
a<-table.element(a,midm[5])
a<-table.element(a,'')
a<-table.row.end(a)
a<-table.row.start(a)
mymid <- hyperlink('midmean.htm', 'Midmean', 'click to view the definition of the Midmean')
mylabel <- paste(mymid,hyperlink('method_6.htm','Closest Observation',''),sep=' - ')
a<-table.element(a,mylabel,header=TRUE)
a<-table.element(a,midm[6])
a<-table.element(a,'')
a<-table.row.end(a)
a<-table.row.start(a)
mymid <- hyperlink('midmean.htm', 'Midmean', 'click to view the definition of the Midmean')
mylabel <- paste(mymid,hyperlink('method_7.htm','True Basic - Statistics Graphics Toolkit',''),sep=' - ')
a<-table.element(a,mylabel,header=TRUE)
a<-table.element(a,midm[7])
a<-table.element(a,'')
a<-table.row.end(a)
a<-table.row.start(a)
mymid <- hyperlink('midmean.htm', 'Midmean', 'click to view the definition of the Midmean')
mylabel <- paste(mymid,hyperlink('method_8.htm','MS Excel (old versions)',''),sep=' - ')
a<-table.element(a,mylabel,header=TRUE)
a<-table.element(a,midm[8])
a<-table.element(a,'')
a<-table.row.end(a)
a<-table.row.start(a)
a<-table.element(a,'Number of observations',header=TRUE)
a<-table.element(a,length(x))
a<-table.element(a,'')
a<-table.row.end(a)
a<-table.end(a)
table.save(a,file='mytable.tab')