Free Statistics
of Irreproducible Research!
Description of Statistical Computation | |||||||||||||||||||||||||||||||||||||||||
|---|---|---|---|---|---|---|---|---|---|---|---|---|---|---|---|---|---|---|---|---|---|---|---|---|---|---|---|---|---|---|---|---|---|---|---|---|---|---|---|---|---|
| Author's title | |||||||||||||||||||||||||||||||||||||||||
| Author | *The author of this computation has been verified* | ||||||||||||||||||||||||||||||||||||||||
| R Software Module | rwasp_univariatedataseries.wasp | ||||||||||||||||||||||||||||||||||||||||
| Title produced by software | Univariate Data Series | ||||||||||||||||||||||||||||||||||||||||
| Date of computation | Mon, 12 Oct 2009 11:52:48 -0600 | ||||||||||||||||||||||||||||||||||||||||
| Cite this page as follows | Statistical Computations at FreeStatistics.org, Office for Research Development and Education, URL https://freestatistics.org/blog/index.php?v=date/2009/Oct/12/t1255370004xo6m5l0o78soc79.htm/, Retrieved Mon, 29 Apr 2024 07:11:38 +0000 | ||||||||||||||||||||||||||||||||||||||||
| Statistical Computations at FreeStatistics.org, Office for Research Development and Education, URL https://freestatistics.org/blog/index.php?pk=45811, Retrieved Mon, 29 Apr 2024 07:11:38 +0000 | |||||||||||||||||||||||||||||||||||||||||
| QR Codes: | |||||||||||||||||||||||||||||||||||||||||
|
| |||||||||||||||||||||||||||||||||||||||||
| Original text written by user: | |||||||||||||||||||||||||||||||||||||||||
| IsPrivate? | No (this computation is public) | ||||||||||||||||||||||||||||||||||||||||
| User-defined keywords | Tijdreeks2 WS2 | ||||||||||||||||||||||||||||||||||||||||
| Estimated Impact | 146 | ||||||||||||||||||||||||||||||||||||||||
Tree of Dependent Computations | |||||||||||||||||||||||||||||||||||||||||
| Family? (F = Feedback message, R = changed R code, M = changed R Module, P = changed Parameters, D = changed Data) | |||||||||||||||||||||||||||||||||||||||||
| - [Univariate Data Series] [WS2] [2009-10-12 17:52:48] [87085ce7f5378f281469a8b1f0969170] [Current] | |||||||||||||||||||||||||||||||||||||||||
| Feedback Forum | |||||||||||||||||||||||||||||||||||||||||
Post a new message | |||||||||||||||||||||||||||||||||||||||||
Dataset | |||||||||||||||||||||||||||||||||||||||||
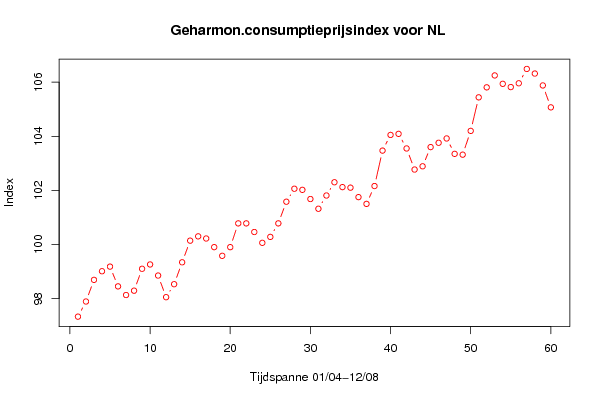
| Dataseries X: | |||||||||||||||||||||||||||||||||||||||||
97.33 97.89 98.69 99.01 99.18 98.45 98.13 98.29 99.10 99.26 98.85 98.05 98.53 99.34 100.14 100.30 100.22 99.90 99.58 99.90 100.78 100.78 100.46 100.06 100.28 100.78 101.58 102.06 102.02 101.68 101.32 101.81 102.30 102.12 102.10 101.75 101.50 102.16 103.47 104.05 104.09 103.55 102.77 102.89 103.60 103.76 103.92 103.35 103.32 104.20 105.44 105.81 106.25 105.94 105.82 105.96 106.49 106.32 105.88 105.07 | |||||||||||||||||||||||||||||||||||||||||
Tables (Output of Computation) | |||||||||||||||||||||||||||||||||||||||||
| |||||||||||||||||||||||||||||||||||||||||
Figures (Output of Computation) | |||||||||||||||||||||||||||||||||||||||||
Input Parameters & R Code | |||||||||||||||||||||||||||||||||||||||||
| Parameters (Session): | |||||||||||||||||||||||||||||||||||||||||
| par1 = Geharmoniseerde consumptieprijsindex ; par2 = CBS, Statline, http://statline.cbs.nl/StatWeb/publication/?DM=SLNL&PA=71099ned&D1=0&D2=104-115,117-128,130-141,143-168&HDR=T&STB=G1&VW=T ; par3 = Productie in Nederland ; | |||||||||||||||||||||||||||||||||||||||||
| Parameters (R input): | |||||||||||||||||||||||||||||||||||||||||
| par1 = Geharmoniseerde consumptieprijsindex ; par2 = CBS, Statline, http://statline.cbs.nl/StatWeb/publication/?DM=SLNL&PA=71099ned&D1=0&D2=104-115,117-128,130-141,143-168&HDR=T&STB=G1&VW=T ; par3 = Productie in Nederland ; | |||||||||||||||||||||||||||||||||||||||||
| R code (references can be found in the software module): | |||||||||||||||||||||||||||||||||||||||||
bitmap(file='test1.png') | |||||||||||||||||||||||||||||||||||||||||