Free Statistics
of Irreproducible Research!
Description of Statistical Computation | |||||||||||||||||||||||||||||||||||||||||
|---|---|---|---|---|---|---|---|---|---|---|---|---|---|---|---|---|---|---|---|---|---|---|---|---|---|---|---|---|---|---|---|---|---|---|---|---|---|---|---|---|---|
| Author's title | |||||||||||||||||||||||||||||||||||||||||
| Author | *The author of this computation has been verified* | ||||||||||||||||||||||||||||||||||||||||
| R Software Module | rwasp_univariatedataseries.wasp | ||||||||||||||||||||||||||||||||||||||||
| Title produced by software | Univariate Data Series | ||||||||||||||||||||||||||||||||||||||||
| Date of computation | Mon, 12 Oct 2009 11:16:57 -0600 | ||||||||||||||||||||||||||||||||||||||||
| Cite this page as follows | Statistical Computations at FreeStatistics.org, Office for Research Development and Education, URL https://freestatistics.org/blog/index.php?v=date/2009/Oct/12/t125536848072vts9ipm0j6dx7.htm/, Retrieved Mon, 29 Apr 2024 03:33:28 +0000 | ||||||||||||||||||||||||||||||||||||||||
| Statistical Computations at FreeStatistics.org, Office for Research Development and Education, URL https://freestatistics.org/blog/index.php?pk=45770, Retrieved Mon, 29 Apr 2024 03:33:28 +0000 | |||||||||||||||||||||||||||||||||||||||||
| QR Codes: | |||||||||||||||||||||||||||||||||||||||||
|
| |||||||||||||||||||||||||||||||||||||||||
| Original text written by user: | Het jaar 2000 gebruikt men als vergelijkingsmaatstaf. Deze data komt van de website belgostat. Url: http://www.nbb.be/belgostat/PublicatieSelectieLinker?LinkID=365000036|910000082&Lang=N | ||||||||||||||||||||||||||||||||||||||||
| IsPrivate? | No (this computation is public) | ||||||||||||||||||||||||||||||||||||||||
| User-defined keywords | |||||||||||||||||||||||||||||||||||||||||
| Estimated Impact | 115 | ||||||||||||||||||||||||||||||||||||||||
Tree of Dependent Computations | |||||||||||||||||||||||||||||||||||||||||
| Family? (F = Feedback message, R = changed R code, M = changed R Module, P = changed Parameters, D = changed Data) | |||||||||||||||||||||||||||||||||||||||||
| - [Univariate Data Series] [Buitenlandse hand...] [2009-10-12 17:16:57] [ac86848d66148c9c4c9404e0c9a511eb] [Current] | |||||||||||||||||||||||||||||||||||||||||
| Feedback Forum | |||||||||||||||||||||||||||||||||||||||||
Post a new message | |||||||||||||||||||||||||||||||||||||||||
Dataset | |||||||||||||||||||||||||||||||||||||||||
| Dataseries X: | |||||||||||||||||||||||||||||||||||||||||
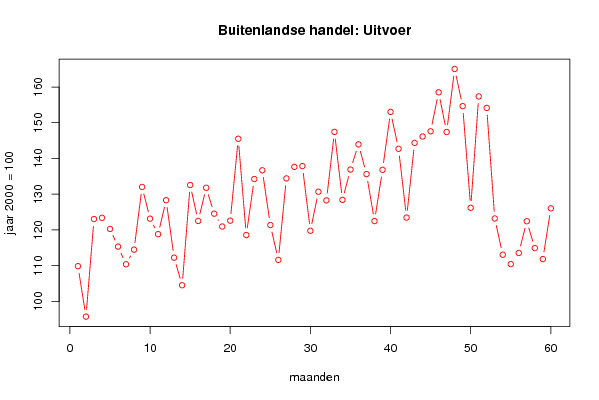
109.87 95.74 123.06 123.39 120.28 115.33 110.4 114.49 132.03 123.16 118.82 128.32 112.24 104.53 132.57 122.52 131.8 124.55 120.96 122.6 145.52 118.57 134.25 136.7 121.37 111.63 134.42 137.65 137.86 119.77 130.69 128.28 147.45 128.42 136.9 143.95 135.64 122.48 136.83 153.04 142.71 123.46 144.37 146.15 147.61 158.51 147.4 165.05 154.64 126.2 157.36 154.15 123.21 113.07 110.45 113.57 122.44 114.93 111.85 126.04 | |||||||||||||||||||||||||||||||||||||||||
Tables (Output of Computation) | |||||||||||||||||||||||||||||||||||||||||
| |||||||||||||||||||||||||||||||||||||||||
Figures (Output of Computation) | |||||||||||||||||||||||||||||||||||||||||
Input Parameters & R Code | |||||||||||||||||||||||||||||||||||||||||
| Parameters (Session): | |||||||||||||||||||||||||||||||||||||||||
| par1 = Uitvoer (in waarden) van de buitenlandse handel van Belgi� ; par2 = http://www.nbb.be/belgostat/PublicatieSelectieLinker?LinkID=365000036|910000082&Lang=N ; par3 = Uitvoer (in waarde) van de Buitenlandse handel van Belgi� volgens het nationale concept - Maandelijkse indexcijfers. ; | |||||||||||||||||||||||||||||||||||||||||
| Parameters (R input): | |||||||||||||||||||||||||||||||||||||||||
| par1 = Uitvoer (in waarden) van de buitenlandse handel van Belgi� ; par2 = http://www.nbb.be/belgostat/PublicatieSelectieLinker?LinkID=365000036|910000082&Lang=N ; par3 = Uitvoer (in waarde) van de Buitenlandse handel van Belgi� volgens het nationale concept - Maandelijkse indexcijfers. ; | |||||||||||||||||||||||||||||||||||||||||
| R code (references can be found in the software module): | |||||||||||||||||||||||||||||||||||||||||
bitmap(file='test1.png') | |||||||||||||||||||||||||||||||||||||||||