Free Statistics
of Irreproducible Research!
Description of Statistical Computation | |||||||||||||||||||||||||||||||||||||||||
|---|---|---|---|---|---|---|---|---|---|---|---|---|---|---|---|---|---|---|---|---|---|---|---|---|---|---|---|---|---|---|---|---|---|---|---|---|---|---|---|---|---|
| Author's title | |||||||||||||||||||||||||||||||||||||||||
| Author | *The author of this computation has been verified* | ||||||||||||||||||||||||||||||||||||||||
| R Software Module | rwasp_univariatedataseries.wasp | ||||||||||||||||||||||||||||||||||||||||
| Title produced by software | Univariate Data Series | ||||||||||||||||||||||||||||||||||||||||
| Date of computation | Mon, 12 Oct 2009 10:56:43 -0600 | ||||||||||||||||||||||||||||||||||||||||
| Cite this page as follows | Statistical Computations at FreeStatistics.org, Office for Research Development and Education, URL https://freestatistics.org/blog/index.php?v=date/2009/Oct/12/t1255366829aq67etplzn9lctp.htm/, Retrieved Mon, 29 Apr 2024 00:28:21 +0000 | ||||||||||||||||||||||||||||||||||||||||
| Statistical Computations at FreeStatistics.org, Office for Research Development and Education, URL https://freestatistics.org/blog/index.php?pk=45723, Retrieved Mon, 29 Apr 2024 00:28:21 +0000 | |||||||||||||||||||||||||||||||||||||||||
| QR Codes: | |||||||||||||||||||||||||||||||||||||||||
|
| |||||||||||||||||||||||||||||||||||||||||
| Original text written by user: | |||||||||||||||||||||||||||||||||||||||||
| IsPrivate? | No (this computation is public) | ||||||||||||||||||||||||||||||||||||||||
| User-defined keywords | Rob_WS2_series1 | ||||||||||||||||||||||||||||||||||||||||
| Estimated Impact | 234 | ||||||||||||||||||||||||||||||||||||||||
Tree of Dependent Computations | |||||||||||||||||||||||||||||||||||||||||
| Family? (F = Feedback message, R = changed R code, M = changed R Module, P = changed Parameters, D = changed Data) | |||||||||||||||||||||||||||||||||||||||||
| - [Univariate Data Series] [WS2] [2009-10-12 16:56:43] [9002751dd674b8c934bf183fdf4510e9] [Current] - RMP [Harrell-Davis Quantiles] [] [2009-10-19 19:27:51] [4f76e114ed5e444b1133aad392380aad] - RMPD [Univariate Summary Statistics] [] [2009-10-28 18:38:42] [4f76e114ed5e444b1133aad392380aad] - RMPD [Univariate Summary Statistics] [] [2009-10-28 19:03:12] [4f76e114ed5e444b1133aad392380aad] - RMPD [Univariate Data Series] [Workshop 5. Zt] [2009-11-02 13:56:04] [d31db4f83c6a129f6d3e47077769e868] - RMPD [Trivariate Scatterplots] [Workshop 5, Triva...] [2009-11-02 14:03:25] [d31db4f83c6a129f6d3e47077769e868] - RM D [Partial Correlation] [Workshop 5. Parti...] [2009-11-02 14:09:25] [d31db4f83c6a129f6d3e47077769e868] F MPD [Univariate Data Series] [] [2009-12-10 13:42:47] [4f76e114ed5e444b1133aad392380aad] - MPD [Univariate Data Series] [] [2009-12-10 14:15:04] [4f76e114ed5e444b1133aad392380aad] - MPD [Univariate Data Series] [] [2009-12-10 14:29:34] [4f76e114ed5e444b1133aad392380aad] - RMPD [Univariate Explorative Data Analysis] [] [2009-12-10 14:58:29] [4f76e114ed5e444b1133aad392380aad] - RMPD [Univariate Explorative Data Analysis] [] [2009-12-10 15:22:20] [4f76e114ed5e444b1133aad392380aad] - RMPD [Univariate Explorative Data Analysis] [Paper EDA Calculator] [2010-12-18 15:10:03] [abf4ff90b26c6b37be4a30063b404639] - RMP [Central Tendency] [Paper CT Verkeers...] [2010-12-19 15:11:24] [abf4ff90b26c6b37be4a30063b404639] - RMPD [Central Tendency] [Paper CT Auto Ins...] [2010-12-19 15:15:16] [abf4ff90b26c6b37be4a30063b404639] - D [Univariate Explorative Data Analysis] [] [2010-12-24 15:18:46] [dd4fe494cff2ee46c12b15bdc7b848ca] - RMPD [Histogram and QQPlot (Reddy-Moores Data)] [] [2010-12-24 15:38:57] [dd4fe494cff2ee46c12b15bdc7b848ca] - RMPD [Histogram and QQPlot (Reddy-Moores Data)] [] [2010-12-24 15:42:08] [dd4fe494cff2ee46c12b15bdc7b848ca] - RMPD [Histogram and QQPlot (Reddy-Moores Data)] [] [2010-12-24 15:43:22] [dd4fe494cff2ee46c12b15bdc7b848ca] - RMPD [Univariate Explorative Data Analysis] [Paper Assumpties ...] [2010-12-18 16:14:36] [74be16979710d4c4e7c6647856088456] | |||||||||||||||||||||||||||||||||||||||||
| Feedback Forum | |||||||||||||||||||||||||||||||||||||||||
Post a new message | |||||||||||||||||||||||||||||||||||||||||
Dataset | |||||||||||||||||||||||||||||||||||||||||
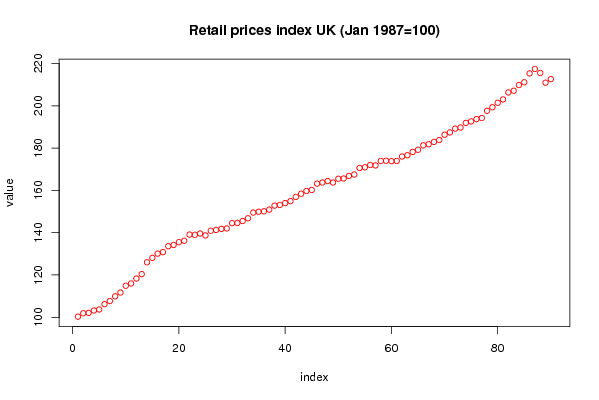
| Dataseries X: | |||||||||||||||||||||||||||||||||||||||||
100.3 101.9 102.1 103.2 103.7 106.2 107.7 109.9 111.7 114.9 116.0 118.3 120.4 126.0 128.1 130.1 130.8 133.6 134.2 135.5 136.2 139.1 139.0 139.6 138.7 140.9 141.3 141.8 142.0 144.5 144.6 145.5 146.8 149.5 149.9 150.1 150.9 152.8 153.1 154.0 154.9 156.9 158.4 159.7 160.2 163.2 163.7 164.4 163.7 165.5 165.6 166.8 167.5 170.6 170.9 172.0 171.8 173.9 174.0 173.8 173.9 176.0 176.6 178.2 179.2 181.3 181.8 182.9 183.8 186.3 187.4 189.2 189.7 191.9 192.6 193.7 194.2 197.6 199.3 201.4 203.0 206.3 207.1 209.8 211.1 215.3 217.4 215.5 210.9 212.6 | |||||||||||||||||||||||||||||||||||||||||
Tables (Output of Computation) | |||||||||||||||||||||||||||||||||||||||||
| |||||||||||||||||||||||||||||||||||||||||
Figures (Output of Computation) | |||||||||||||||||||||||||||||||||||||||||
Input Parameters & R Code | |||||||||||||||||||||||||||||||||||||||||
| Parameters (Session): | |||||||||||||||||||||||||||||||||||||||||
| par1 = RPI: All items retail prices index (January 1987=100) Not seasonally adjusted ; par2 = http://www.statistics.gov.uk/statbase/ ; par3 = RPI: All items retail prices index (January 1987=100) Not seasonally adjusted ; | |||||||||||||||||||||||||||||||||||||||||
| Parameters (R input): | |||||||||||||||||||||||||||||||||||||||||
| par1 = RPI: All items retail prices index (January 1987=100) Not seasonally adjusted ; par2 = http://www.statistics.gov.uk/statbase/ ; par3 = RPI: All items retail prices index (January 1987=100) Not seasonally adjusted ; | |||||||||||||||||||||||||||||||||||||||||
| R code (references can be found in the software module): | |||||||||||||||||||||||||||||||||||||||||
bitmap(file='test1.png') | |||||||||||||||||||||||||||||||||||||||||