Free Statistics
of Irreproducible Research!
Description of Statistical Computation | |||||||||||||||||||||||||||||||||||||||||
|---|---|---|---|---|---|---|---|---|---|---|---|---|---|---|---|---|---|---|---|---|---|---|---|---|---|---|---|---|---|---|---|---|---|---|---|---|---|---|---|---|---|
| Author's title | |||||||||||||||||||||||||||||||||||||||||
| Author | *The author of this computation has been verified* | ||||||||||||||||||||||||||||||||||||||||
| R Software Module | rwasp_univariatedataseries.wasp | ||||||||||||||||||||||||||||||||||||||||
| Title produced by software | Univariate Data Series | ||||||||||||||||||||||||||||||||||||||||
| Date of computation | Mon, 12 Oct 2009 10:55:02 -0600 | ||||||||||||||||||||||||||||||||||||||||
| Cite this page as follows | Statistical Computations at FreeStatistics.org, Office for Research Development and Education, URL https://freestatistics.org/blog/index.php?v=date/2009/Oct/12/t1255366647h9eb1jh7pzgn6ns.htm/, Retrieved Sun, 28 Apr 2024 22:22:35 +0000 | ||||||||||||||||||||||||||||||||||||||||
| Statistical Computations at FreeStatistics.org, Office for Research Development and Education, URL https://freestatistics.org/blog/index.php?pk=45719, Retrieved Sun, 28 Apr 2024 22:22:35 +0000 | |||||||||||||||||||||||||||||||||||||||||
| QR Codes: | |||||||||||||||||||||||||||||||||||||||||
|
| |||||||||||||||||||||||||||||||||||||||||
| Original text written by user: | |||||||||||||||||||||||||||||||||||||||||
| IsPrivate? | No (this computation is public) | ||||||||||||||||||||||||||||||||||||||||
| User-defined keywords | |||||||||||||||||||||||||||||||||||||||||
| Estimated Impact | 169 | ||||||||||||||||||||||||||||||||||||||||
Tree of Dependent Computations | |||||||||||||||||||||||||||||||||||||||||
| Family? (F = Feedback message, R = changed R code, M = changed R Module, P = changed Parameters, D = changed Data) | |||||||||||||||||||||||||||||||||||||||||
| - [Univariate Data Series] [workshop 2] [2009-10-12 16:55:02] [82bf023f1e4d9556a54030fcde33aa09] [Current] - RMPD [Central Tendency] [] [2009-10-22 15:25:32] [3af9fa3d2c04a43d660a9a466bdfbaa0] - RMPD [Univariate Explorative Data Analysis] [] [2009-10-22 15:32:00] [3af9fa3d2c04a43d660a9a466bdfbaa0] - RMPD [Univariate Explorative Data Analysis] [] [2009-10-22 15:37:14] [3af9fa3d2c04a43d660a9a466bdfbaa0] - RMPD [Univariate Explorative Data Analysis] [] [2009-10-22 15:42:37] [3af9fa3d2c04a43d660a9a466bdfbaa0] | |||||||||||||||||||||||||||||||||||||||||
| Feedback Forum | |||||||||||||||||||||||||||||||||||||||||
Post a new message | |||||||||||||||||||||||||||||||||||||||||
Dataset | |||||||||||||||||||||||||||||||||||||||||
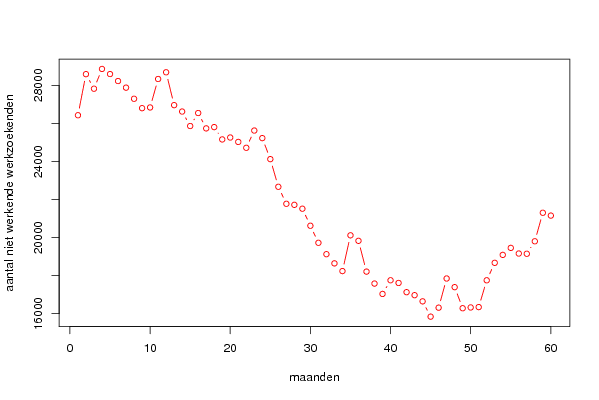
| Dataseries X: | |||||||||||||||||||||||||||||||||||||||||
26 434 28 595 27 829 28 868 28 600 28 232 27 884 27 300 26 806 26 843 28 340 28 693 26 964 26 628 25 867 26 551 25 743 25 810 25 162 25 263 25 031 24 722 25 629 25 231 24 126 22 672 21 778 21 724 21 520 20 624 19 727 19 128 18 646 18 240 20 121 19 831 18 212 17 584 17 038 17 757 17 616 17 130 16 973 16 649 15 844 16 316 17 850 17 394 16 287 16 328 16 347 17 756 18 674 19 092 19 460 19 163 19 150 19 807 21 306 21 157 | |||||||||||||||||||||||||||||||||||||||||
Tables (Output of Computation) | |||||||||||||||||||||||||||||||||||||||||
| |||||||||||||||||||||||||||||||||||||||||
Figures (Output of Computation) | |||||||||||||||||||||||||||||||||||||||||
Input Parameters & R Code | |||||||||||||||||||||||||||||||||||||||||
| Parameters (Session): | |||||||||||||||||||||||||||||||||||||||||
| par1 = aantal niet werkende werkzoekenden bij 40 jaar tot -45 jaar ; par2 = http://www.nbb.be/belgostat/PresentationLinker?TableId=417000065&Lang=N ; par3 = dit zijn aantallen niet werkende werkzoekenden ; | |||||||||||||||||||||||||||||||||||||||||
| Parameters (R input): | |||||||||||||||||||||||||||||||||||||||||
| par1 = aantal niet werkende werkzoekenden bij 40 jaar tot -45 jaar ; par2 = http://www.nbb.be/belgostat/PresentationLinker?TableId=417000065&Lang=N ; par3 = dit zijn aantallen niet werkende werkzoekenden ; | |||||||||||||||||||||||||||||||||||||||||
| R code (references can be found in the software module): | |||||||||||||||||||||||||||||||||||||||||
bitmap(file='test1.png') | |||||||||||||||||||||||||||||||||||||||||