Free Statistics
of Irreproducible Research!
Description of Statistical Computation | |||||||||||||||||||||||||||||||||||||||||
|---|---|---|---|---|---|---|---|---|---|---|---|---|---|---|---|---|---|---|---|---|---|---|---|---|---|---|---|---|---|---|---|---|---|---|---|---|---|---|---|---|---|
| Author's title | |||||||||||||||||||||||||||||||||||||||||
| Author | *The author of this computation has been verified* | ||||||||||||||||||||||||||||||||||||||||
| R Software Module | rwasp_univariatedataseries.wasp | ||||||||||||||||||||||||||||||||||||||||
| Title produced by software | Univariate Data Series | ||||||||||||||||||||||||||||||||||||||||
| Date of computation | Mon, 12 Oct 2009 10:46:34 -0600 | ||||||||||||||||||||||||||||||||||||||||
| Cite this page as follows | Statistical Computations at FreeStatistics.org, Office for Research Development and Education, URL https://freestatistics.org/blog/index.php?v=date/2009/Oct/12/t1255366086sky4zr5kr3jybjc.htm/, Retrieved Mon, 29 Apr 2024 03:24:59 +0000 | ||||||||||||||||||||||||||||||||||||||||
| Statistical Computations at FreeStatistics.org, Office for Research Development and Education, URL https://freestatistics.org/blog/index.php?pk=45703, Retrieved Mon, 29 Apr 2024 03:24:59 +0000 | |||||||||||||||||||||||||||||||||||||||||
| QR Codes: | |||||||||||||||||||||||||||||||||||||||||
|
| |||||||||||||||||||||||||||||||||||||||||
| Original text written by user: | |||||||||||||||||||||||||||||||||||||||||
| IsPrivate? | No (this computation is public) | ||||||||||||||||||||||||||||||||||||||||
| User-defined keywords | |||||||||||||||||||||||||||||||||||||||||
| Estimated Impact | 155 | ||||||||||||||||||||||||||||||||||||||||
Tree of Dependent Computations | |||||||||||||||||||||||||||||||||||||||||
| Family? (F = Feedback message, R = changed R code, M = changed R Module, P = changed Parameters, D = changed Data) | |||||||||||||||||||||||||||||||||||||||||
| - [Univariate Data Series] [workshop 2] [2009-10-12 16:46:34] [82bf023f1e4d9556a54030fcde33aa09] [Current] | |||||||||||||||||||||||||||||||||||||||||
| Feedback Forum | |||||||||||||||||||||||||||||||||||||||||
Post a new message | |||||||||||||||||||||||||||||||||||||||||
Dataset | |||||||||||||||||||||||||||||||||||||||||
| Dataseries X: | |||||||||||||||||||||||||||||||||||||||||
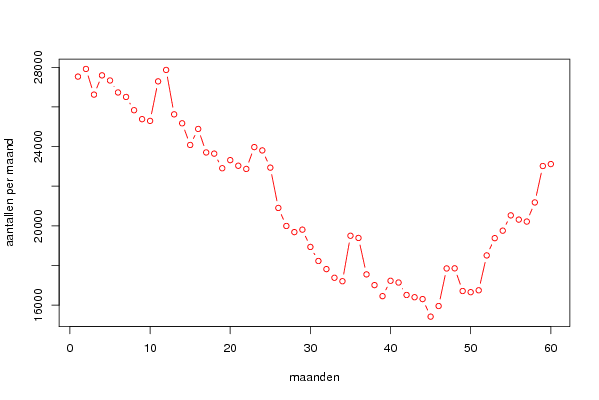
27 530 27 916 26 621 27 593 27 335 26 730 26 503 25 835 25 383 25 296 27 290 27 866 25 627 25 175 24 081 24 889 23 704 23 644 22 908 23 316 23 033 22 872 23 974 23 807 22 938 20 905 19 995 19 685 19 809 18 938 18 229 17 819 17 383 17 209 19 502 19 391 17 553 17 012 16 455 17 230 17 142 16 514 16 401 16 307 15 421 15 956 17 853 17 859 16 714 16 656 16 751 18 510 19 381 19 758 20 531 20 316 20 218 21 182 23 020 23 118 | |||||||||||||||||||||||||||||||||||||||||
Tables (Output of Computation) | |||||||||||||||||||||||||||||||||||||||||
| |||||||||||||||||||||||||||||||||||||||||
Figures (Output of Computation) | |||||||||||||||||||||||||||||||||||||||||
Input Parameters & R Code | |||||||||||||||||||||||||||||||||||||||||
| Parameters (Session): | |||||||||||||||||||||||||||||||||||||||||
| par1 = werkloosheidsgraad in vlaanderen bij 30 jaar tot -35 jaar ; par2 = http://www.nbb.be/belgostat/PresentationLinker?TableId=417000065&Lang=N ; par3 = dit zijn aantallen niet werkende werkzoekenden ; | |||||||||||||||||||||||||||||||||||||||||
| Parameters (R input): | |||||||||||||||||||||||||||||||||||||||||
| par1 = werkloosheidsgraad in vlaanderen bij 30 jaar tot -35 jaar ; par2 = http://www.nbb.be/belgostat/PresentationLinker?TableId=417000065&Lang=N ; par3 = dit zijn aantallen niet werkende werkzoekenden ; | |||||||||||||||||||||||||||||||||||||||||
| R code (references can be found in the software module): | |||||||||||||||||||||||||||||||||||||||||
bitmap(file='test1.png') | |||||||||||||||||||||||||||||||||||||||||