\begin{tabular}{lllllllll}
\hline
Summary of computational transaction \tabularnewline
Raw Input & view raw input (R code)  \tabularnewline
Raw Output & view raw output of R engine  \tabularnewline
Computing time & 1 seconds \tabularnewline
R Server & 'Gwilym Jenkins' @ 72.249.127.135 \tabularnewline
\hline
\end{tabular}
%Source: https://freestatistics.org/blog/index.php?pk=45682&T=0
[TABLE]
[ROW][C]Summary of computational transaction[/C][/ROW]
[ROW][C]Raw Input[/C][C]view raw input (R code) [/C][/ROW]
[ROW][C]Raw Output[/C][C]view raw output of R engine [/C][/ROW]
[ROW][C]Computing time[/C][C]1 seconds[/C][/ROW]
[ROW][C]R Server[/C][C]'Gwilym Jenkins' @ 72.249.127.135[/C][/ROW]
[/TABLE]
Source: https://freestatistics.org/blog/index.php?pk=45682&T=0
If you paste this QR Code into your document, anyone with a smartphone or tablet will be able to scan it and view this table in a browser.
If you paste this QR Code into your document, anyone with a smartphone or tablet will be able to scan it and view this table in a browser.
If you paste this QR Code into your document, anyone with a smartphone or tablet will be able to scan it and view this table in a browser.
If you paste this QR Code into your document, anyone with a smartphone or tablet will be able to scan it and view this table in a browser.
If you paste this QR Code into your document, anyone with a smartphone or tablet will be able to scan it and view this table in a browser.
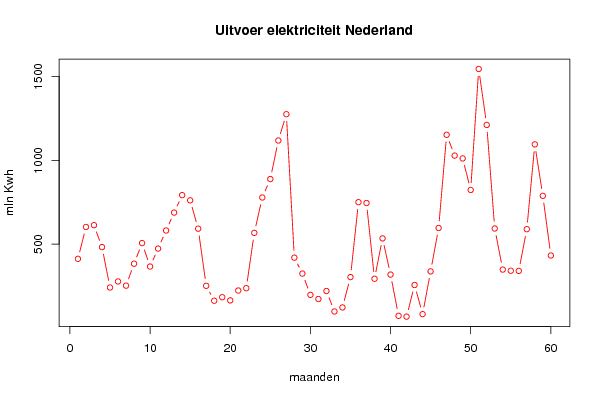
| Univariate Dataseries | | Name of dataseries | Uitvoer elektriciteit Nederland | | Source | http://statline.cbs.nl/StatWeb/publication/?DM=SLNL&PA=00377&D1=0,4-6&D2=228-230,232-234,236-238,240-242,245-247,249-251,253-255,257-259,262-264,266-268,270-272,274-276,279-281,283-285,287-289,291-293,296-298,300-306,308-310,313-315,317-321&HDR=T&STB=G1&VW=T | | Description | Elektriciteit die via het hoogspanningsnet het land uitgaat. Nederland | | Number of observations | 60 |
\begin{tabular}{lllllllll}
\hline
Univariate Dataseries \tabularnewline
Name of dataseries & Uitvoer elektriciteit Nederland \tabularnewline
Source & http://statline.cbs.nl/StatWeb/publication/?DM=SLNL&PA=00377&D1=0,4-6&D2=228-230,232-234,236-238,240-242,245-247,249-251,253-255,257-259,262-264,266-268,270-272,274-276,279-281,283-285,287-289,291-293,296-298,300-306,308-310,313-315,317-321&HDR=T&STB=G1&VW=T \tabularnewline
Description & Elektriciteit die via het hoogspanningsnet het land uitgaat. Nederland \tabularnewline
Number of observations & 60 \tabularnewline
\hline
\end{tabular}
%Source: https://freestatistics.org/blog/index.php?pk=45682&T=1
[TABLE]
[ROW][C]Univariate Dataseries[/C][/ROW]
[ROW][C]Name of dataseries[/C][C]Uitvoer elektriciteit Nederland[/C][/ROW]
[ROW][C]Source[/C][C]http://statline.cbs.nl/StatWeb/publication/?DM=SLNL&PA=00377&D1=0,4-6&D2=228-230,232-234,236-238,240-242,245-247,249-251,253-255,257-259,262-264,266-268,270-272,274-276,279-281,283-285,287-289,291-293,296-298,300-306,308-310,313-315,317-321&HDR=T&STB=G1&VW=T[/C][/ROW]
[ROW][C]Description[/C][C]Elektriciteit die via het hoogspanningsnet het land uitgaat. Nederland[/C][/ROW]
[ROW][C]Number of observations[/C][C]60[/C][/ROW]
[/TABLE]
Source: https://freestatistics.org/blog/index.php?pk=45682&T=1
Globally Unique Identifier (entire table): ba.freestatistics.org/blog/index.php?pk=45682&T=1
As an alternative you can also use a QR Code:
The GUIDs for individual cells are displayed in the table below:
| Univariate Dataseries | | Name of dataseries | Uitvoer elektriciteit Nederland | | Source | http://statline.cbs.nl/StatWeb/publication/?DM=SLNL&PA=00377&D1=0,4-6&D2=228-230,232-234,236-238,240-242,245-247,249-251,253-255,257-259,262-264,266-268,270-272,274-276,279-281,283-285,287-289,291-293,296-298,300-306,308-310,313-315,317-321&HDR=T&STB=G1&VW=T | | Description | Elektriciteit die via het hoogspanningsnet het land uitgaat. Nederland | | Number of observations | 60 |
If you paste this QR Code into your document, anyone with a smartphone or tablet will be able to scan it and view this table in a browser.
If you paste this QR Code into your document, anyone with a smartphone or tablet will be able to scan it and view this table in a browser.
If you paste this QR Code into your document, anyone with a smartphone or tablet will be able to scan it and view this table in a browser.
If you paste this QR Code into your document, anyone with a smartphone or tablet will be able to scan it and view this table in a browser.
If you paste this QR Code into your document, anyone with a smartphone or tablet will be able to scan it and view this table in a browser.
|