Free Statistics
of Irreproducible Research!
Description of Statistical Computation | |||||||||||||||||||||||||||||||||||||||||
|---|---|---|---|---|---|---|---|---|---|---|---|---|---|---|---|---|---|---|---|---|---|---|---|---|---|---|---|---|---|---|---|---|---|---|---|---|---|---|---|---|---|
| Author's title | |||||||||||||||||||||||||||||||||||||||||
| Author | *The author of this computation has been verified* | ||||||||||||||||||||||||||||||||||||||||
| R Software Module | rwasp_univariatedataseries.wasp | ||||||||||||||||||||||||||||||||||||||||
| Title produced by software | Univariate Data Series | ||||||||||||||||||||||||||||||||||||||||
| Date of computation | Mon, 12 Oct 2009 01:09:47 -0600 | ||||||||||||||||||||||||||||||||||||||||
| Cite this page as follows | Statistical Computations at FreeStatistics.org, Office for Research Development and Education, URL https://freestatistics.org/blog/index.php?v=date/2009/Oct/12/t1255331441oiqlkffrkxucv35.htm/, Retrieved Mon, 29 Apr 2024 05:25:24 +0000 | ||||||||||||||||||||||||||||||||||||||||
| Statistical Computations at FreeStatistics.org, Office for Research Development and Education, URL https://freestatistics.org/blog/index.php?pk=45423, Retrieved Mon, 29 Apr 2024 05:25:24 +0000 | |||||||||||||||||||||||||||||||||||||||||
| QR Codes: | |||||||||||||||||||||||||||||||||||||||||
|
| |||||||||||||||||||||||||||||||||||||||||
| Original text written by user: | |||||||||||||||||||||||||||||||||||||||||
| IsPrivate? | No (this computation is public) | ||||||||||||||||||||||||||||||||||||||||
| User-defined keywords | HSWWS2Q2 | ||||||||||||||||||||||||||||||||||||||||
| Estimated Impact | 160 | ||||||||||||||||||||||||||||||||||||||||
Tree of Dependent Computations | |||||||||||||||||||||||||||||||||||||||||
| Family? (F = Feedback message, R = changed R code, M = changed R Module, P = changed Parameters, D = changed Data) | |||||||||||||||||||||||||||||||||||||||||
| - [Univariate Data Series] [] [2009-10-12 07:09:47] [4563e36d4b7005634fe3557528d9fcab] [Current] | |||||||||||||||||||||||||||||||||||||||||
| Feedback Forum | |||||||||||||||||||||||||||||||||||||||||
Post a new message | |||||||||||||||||||||||||||||||||||||||||
Dataset | |||||||||||||||||||||||||||||||||||||||||
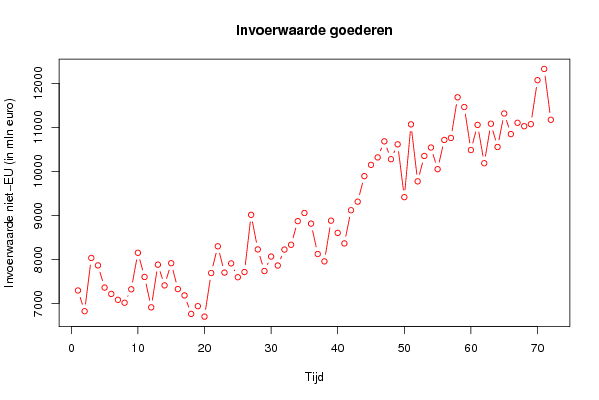
| Dataseries X: | |||||||||||||||||||||||||||||||||||||||||
7 291 6 820 8 031 7 862 7 357 7 213 7 079 7 012 7 319 8 148 7 599 6 908 7 878 7 407 7 911 7 323 7 179 6 758 6 934 6 696 7 688 8 296 7 697 7 907 7 592 7 710 9 011 8 225 7 733 8 062 7 859 8 221 8 330 8 868 9 053 8 811 8 120 7 953 8 878 8 601 8 361 9 116 9 310 9 891 10 147 10 317 10 682 10 276 10 614 9 413 11 068 9 772 10 350 10 541 10 049 10 714 10 759 11 684 11 462 10 485 11 056 10 184 11 082 10 554 11 315 10 847 11 104 11 026 11 073 12 073 12 328 11 172 | |||||||||||||||||||||||||||||||||||||||||
Tables (Output of Computation) | |||||||||||||||||||||||||||||||||||||||||
| |||||||||||||||||||||||||||||||||||||||||
Figures (Output of Computation) | |||||||||||||||||||||||||||||||||||||||||
Input Parameters & R Code | |||||||||||||||||||||||||||||||||||||||||
| Parameters (Session): | |||||||||||||||||||||||||||||||||||||||||
| par1 = Invoerwaarde van goederen ; par2 = http://statline.cbs.nl/StatWeb/publication/default.aspx?DM=SLNL&PA=70017&D1=5-6&D2=0&D3=1-2&D4=0-11%2c13-24%2c26-37%2c39-50%2c52-63%2c65-98&HDR=T&STB=G1%2cG2%2cG3&VW=T ; | |||||||||||||||||||||||||||||||||||||||||
| Parameters (R input): | |||||||||||||||||||||||||||||||||||||||||
| par1 = Invoerwaarde van goederen ; par2 = http://statline.cbs.nl/StatWeb/publication/default.aspx?DM=SLNL&PA=70017&D1=5-6&D2=0&D3=1-2&D4=0-11%2c13-24%2c26-37%2c39-50%2c52-63%2c65-98&HDR=T&STB=G1%2cG2%2cG3&VW=T ; par3 = ; | |||||||||||||||||||||||||||||||||||||||||
| R code (references can be found in the software module): | |||||||||||||||||||||||||||||||||||||||||
bitmap(file='test1.png') | |||||||||||||||||||||||||||||||||||||||||