Free Statistics
of Irreproducible Research!
Description of Statistical Computation | |||||||||||||||||||||||||||||||||||||||||
|---|---|---|---|---|---|---|---|---|---|---|---|---|---|---|---|---|---|---|---|---|---|---|---|---|---|---|---|---|---|---|---|---|---|---|---|---|---|---|---|---|---|
| Author's title | |||||||||||||||||||||||||||||||||||||||||
| Author | *Unverified author* | ||||||||||||||||||||||||||||||||||||||||
| R Software Module | rwasp_univariatedataseries.wasp | ||||||||||||||||||||||||||||||||||||||||
| Title produced by software | Univariate Data Series | ||||||||||||||||||||||||||||||||||||||||
| Date of computation | Fri, 09 Oct 2009 07:59:35 -0600 | ||||||||||||||||||||||||||||||||||||||||
| Cite this page as follows | Statistical Computations at FreeStatistics.org, Office for Research Development and Education, URL https://freestatistics.org/blog/index.php?v=date/2009/Oct/09/t1255096861p8wkc7hu73uwp60.htm/, Retrieved Tue, 08 Jul 2025 05:53:27 +0000 | ||||||||||||||||||||||||||||||||||||||||
| Statistical Computations at FreeStatistics.org, Office for Research Development and Education, URL https://freestatistics.org/blog/index.php?pk=45078, Retrieved Tue, 08 Jul 2025 05:53:27 +0000 | |||||||||||||||||||||||||||||||||||||||||
| QR Codes: | |||||||||||||||||||||||||||||||||||||||||
|
| |||||||||||||||||||||||||||||||||||||||||
| Original text written by user: | |||||||||||||||||||||||||||||||||||||||||
| IsPrivate? | No (this computation is public) | ||||||||||||||||||||||||||||||||||||||||
| User-defined keywords | KDGP1W1 | ||||||||||||||||||||||||||||||||||||||||
| Estimated Impact | 274 | ||||||||||||||||||||||||||||||||||||||||
Tree of Dependent Computations | |||||||||||||||||||||||||||||||||||||||||
| Family? (F = Feedback message, R = changed R code, M = changed R Module, P = changed Parameters, D = changed Data) | |||||||||||||||||||||||||||||||||||||||||
| - [Univariate Data Series] [] [2009-10-09 13:59:35] [ab5cffebaafedfca74d2c063d2ba2ba4] [Current] - RMPD [Histogram] [] [2009-10-09 15:20:49] [2186dd2f385e1ccfa008ccec8e23764c] - RMPD [Kernel Density Estimation] [] [2009-10-09 15:27:01] [2186dd2f385e1ccfa008ccec8e23764c] | |||||||||||||||||||||||||||||||||||||||||
| Feedback Forum | |||||||||||||||||||||||||||||||||||||||||
Post a new message | |||||||||||||||||||||||||||||||||||||||||
Dataset | |||||||||||||||||||||||||||||||||||||||||
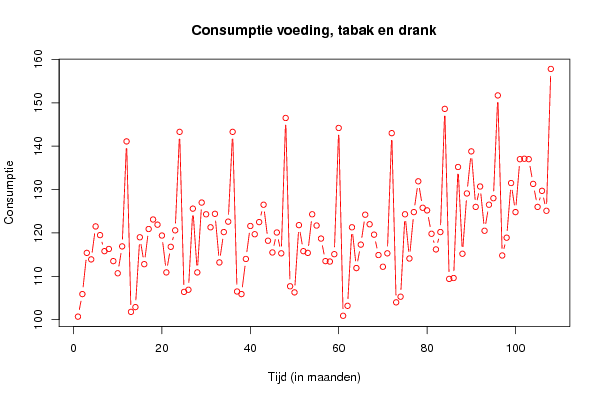
| Dataseries X: | |||||||||||||||||||||||||||||||||||||||||
100,7 105,9 115,4 113,9 121,5 119,5 115,8 116,3 113,5 110,7 116,9 141,1 101,8 102,9 119 112,8 120,9 123,1 121,9 119,4 110,9 116,8 120,6 143,3 106,4 106,9 125,6 110,9 127 124,3 121,3 124,4 113,2 120,2 122,6 143,3 106,5 105,9 114 121,6 119,7 122,5 126,5 118,2 115,5 120,1 115,3 146,5 107,7 106,3 121,8 115,8 115,4 124,3 121,7 118,7 113,5 113,4 115,1 144,2 100,9 103,2 121,3 111,9 117,3 124,2 122 119,6 114,9 112,2 115,3 143 104 105,3 124,3 114,1 124,8 131,9 125,8 125,2 119,8 116,2 120,2 148,6 109,4 109,6 135,2 115,2 129,1 138,8 126 130,7 120,5 126,5 128 151,7 114,8 118,9 131,5 124,8 137 137,1 137 131,3 126 129,7 125,1 157,8 | |||||||||||||||||||||||||||||||||||||||||
Tables (Output of Computation) | |||||||||||||||||||||||||||||||||||||||||
| |||||||||||||||||||||||||||||||||||||||||
Figures (Output of Computation) | |||||||||||||||||||||||||||||||||||||||||
Input Parameters & R Code | |||||||||||||||||||||||||||||||||||||||||
| Parameters (Session): | |||||||||||||||||||||||||||||||||||||||||
| par1 = Volume index van consumptie van voedingswaren, tabaksgoederen en drank in Noorwegen ; par2 = Onderzoek ; par3 = Consumptie voeding, tabak en drank in Noorwegen ; | |||||||||||||||||||||||||||||||||||||||||
| Parameters (R input): | |||||||||||||||||||||||||||||||||||||||||
| par1 = Volume index van consumptie van voedingswaren, tabaksgoederen en drank in Noorwegen ; par2 = Onderzoek ; par3 = Consumptie voeding, tabak en drank in Noorwegen ; | |||||||||||||||||||||||||||||||||||||||||
| R code (references can be found in the software module): | |||||||||||||||||||||||||||||||||||||||||
bitmap(file='test1.png') | |||||||||||||||||||||||||||||||||||||||||