Free Statistics
of Irreproducible Research!
Description of Statistical Computation | |||||||||||||||||||||||||||||||||||||||||
|---|---|---|---|---|---|---|---|---|---|---|---|---|---|---|---|---|---|---|---|---|---|---|---|---|---|---|---|---|---|---|---|---|---|---|---|---|---|---|---|---|---|
| Author's title | |||||||||||||||||||||||||||||||||||||||||
| Author | *The author of this computation has been verified* | ||||||||||||||||||||||||||||||||||||||||
| R Software Module | rwasp_univariatedataseries.wasp | ||||||||||||||||||||||||||||||||||||||||
| Title produced by software | Univariate Data Series | ||||||||||||||||||||||||||||||||||||||||
| Date of computation | Fri, 09 Oct 2009 06:59:13 -0600 | ||||||||||||||||||||||||||||||||||||||||
| Cite this page as follows | Statistical Computations at FreeStatistics.org, Office for Research Development and Education, URL https://freestatistics.org/blog/index.php?v=date/2009/Oct/09/t1255093456ajqdcm4x9ryqt2r.htm/, Retrieved Sun, 13 Jul 2025 09:56:34 +0000 | ||||||||||||||||||||||||||||||||||||||||
| Statistical Computations at FreeStatistics.org, Office for Research Development and Education, URL https://freestatistics.org/blog/index.php?pk=45055, Retrieved Sun, 13 Jul 2025 09:56:34 +0000 | |||||||||||||||||||||||||||||||||||||||||
| QR Codes: | |||||||||||||||||||||||||||||||||||||||||
|
| |||||||||||||||||||||||||||||||||||||||||
| Original text written by user: | |||||||||||||||||||||||||||||||||||||||||
| IsPrivate? | No (this computation is public) | ||||||||||||||||||||||||||||||||||||||||
| User-defined keywords | ws2tijdreeks2-2 | ||||||||||||||||||||||||||||||||||||||||
| Estimated Impact | 241 | ||||||||||||||||||||||||||||||||||||||||
Tree of Dependent Computations | |||||||||||||||||||||||||||||||||||||||||
| Family? (F = Feedback message, R = changed R code, M = changed R Module, P = changed Parameters, D = changed Data) | |||||||||||||||||||||||||||||||||||||||||
| - [Univariate Data Series] [] [2009-10-09 12:59:13] [2b548c9d2e9bba6e1eaf65bd4d551f41] [Current] | |||||||||||||||||||||||||||||||||||||||||
| Feedback Forum | |||||||||||||||||||||||||||||||||||||||||
Post a new message | |||||||||||||||||||||||||||||||||||||||||
Dataset | |||||||||||||||||||||||||||||||||||||||||
| Dataseries X: | |||||||||||||||||||||||||||||||||||||||||
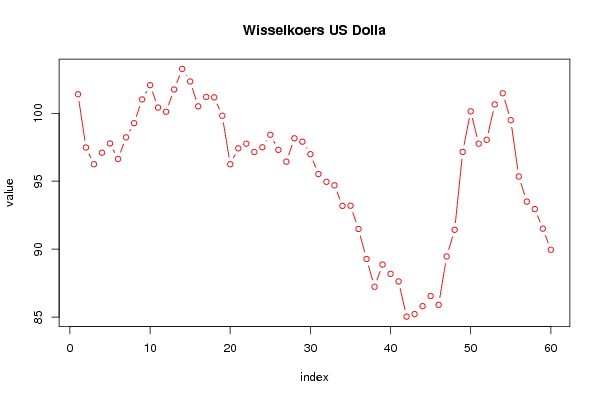
101.4 97.48 96.25 97.1 97.78 96.64 98.23 99.27 101.02 102.07 100.42 100.11 101.75 103.26 102.34 100.51 101.2 101.17 99.82 96.25 97.42 97.76 97.15 97.5 98.42 97.31 96.44 98.16 97.91 96.99 95.53 94.96 94.7 93.19 93.2 91.49 89.28 87.24 88.87 88.19 87.63 85.04 85.23 85.81 86.56 85.91 89.47 91.43 97.16 100.14 97.76 98.05 100.65 101.47 99.49 95.35 93.5 92.95 91.51 89.96 | |||||||||||||||||||||||||||||||||||||||||
Tables (Output of Computation) | |||||||||||||||||||||||||||||||||||||||||
| |||||||||||||||||||||||||||||||||||||||||
Figures (Output of Computation) | |||||||||||||||||||||||||||||||||||||||||
Input Parameters & R Code | |||||||||||||||||||||||||||||||||||||||||
| Parameters (Session): | |||||||||||||||||||||||||||||||||||||||||
| par1 = Nominale effectieve wisselkoers US Dollar per maand ; par2 = http://www.nbb.be/belgostat/PresentationLinker?TableId=811000022&Lang=N ; par3 = Nominale effectieve wisselkoers US Dollar per maand ; | |||||||||||||||||||||||||||||||||||||||||
| Parameters (R input): | |||||||||||||||||||||||||||||||||||||||||
| par1 = Nominale effectieve wisselkoers US Dollar per maand ; par2 = http://www.nbb.be/belgostat/PresentationLinker?TableId=811000022&Lang=N ; par3 = Nominale effectieve wisselkoers US Dollar per maand ; | |||||||||||||||||||||||||||||||||||||||||
| R code (references can be found in the software module): | |||||||||||||||||||||||||||||||||||||||||
bitmap(file='test1.png') | |||||||||||||||||||||||||||||||||||||||||