Free Statistics
of Irreproducible Research!
Description of Statistical Computation | |||||||||||||||||||||||||||||||||||||||||
|---|---|---|---|---|---|---|---|---|---|---|---|---|---|---|---|---|---|---|---|---|---|---|---|---|---|---|---|---|---|---|---|---|---|---|---|---|---|---|---|---|---|
| Author's title | |||||||||||||||||||||||||||||||||||||||||
| Author | *Unverified author* | ||||||||||||||||||||||||||||||||||||||||
| R Software Module | rwasp_univariatedataseries.wasp | ||||||||||||||||||||||||||||||||||||||||
| Title produced by software | Univariate Data Series | ||||||||||||||||||||||||||||||||||||||||
| Date of computation | Wed, 07 Oct 2009 09:49:07 -0600 | ||||||||||||||||||||||||||||||||||||||||
| Cite this page as follows | Statistical Computations at FreeStatistics.org, Office for Research Development and Education, URL https://freestatistics.org/blog/index.php?v=date/2009/Oct/07/t12549305949wbf86y20noh8w8.htm/, Retrieved Sat, 27 Apr 2024 17:13:35 +0000 | ||||||||||||||||||||||||||||||||||||||||
| Statistical Computations at FreeStatistics.org, Office for Research Development and Education, URL https://freestatistics.org/blog/index.php?pk=44629, Retrieved Sat, 27 Apr 2024 17:13:35 +0000 | |||||||||||||||||||||||||||||||||||||||||
| QR Codes: | |||||||||||||||||||||||||||||||||||||||||
|
| |||||||||||||||||||||||||||||||||||||||||
| Original text written by user: | |||||||||||||||||||||||||||||||||||||||||
| IsPrivate? | No (this computation is public) | ||||||||||||||||||||||||||||||||||||||||
| User-defined keywords | ws2 - sp500 | ||||||||||||||||||||||||||||||||||||||||
| Estimated Impact | 117 | ||||||||||||||||||||||||||||||||||||||||
Tree of Dependent Computations | |||||||||||||||||||||||||||||||||||||||||
| Family? (F = Feedback message, R = changed R code, M = changed R Module, P = changed Parameters, D = changed Data) | |||||||||||||||||||||||||||||||||||||||||
| - [Univariate Data Series] [ws2 - sp500] [2009-10-07 15:49:07] [849dd9ed52b0e60297f2d5572dc0bad5] [Current] - PD [Univariate Data Series] [ws3- Y(t) / X(t)] [2009-10-20 20:45:13] [74be16979710d4c4e7c6647856088456] - RMPD [Univariate Explorative Data Analysis] [ws3 - Y(t) / X(t)...] [2009-10-20 20:47:47] [74be16979710d4c4e7c6647856088456] - RMPD [Univariate Explorative Data Analysis] [ws3- assumpties e...] [2009-10-20 20:55:10] [74be16979710d4c4e7c6647856088456] - RMP [Univariate Explorative Data Analysis] [ws3 - assumpties ...] [2009-10-20 21:45:04] [74be16979710d4c4e7c6647856088456] | |||||||||||||||||||||||||||||||||||||||||
| Feedback Forum | |||||||||||||||||||||||||||||||||||||||||
Post a new message | |||||||||||||||||||||||||||||||||||||||||
Dataset | |||||||||||||||||||||||||||||||||||||||||
| Dataseries X: | |||||||||||||||||||||||||||||||||||||||||
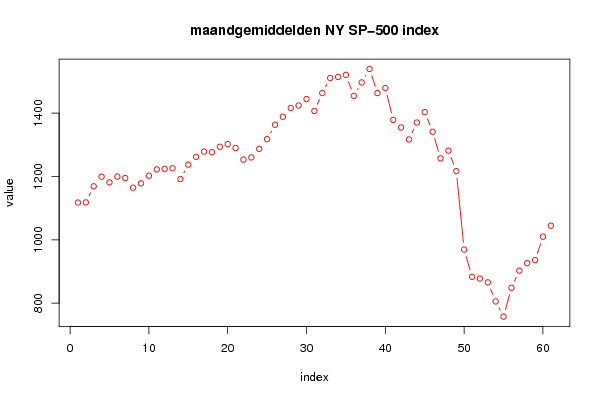
1117.66 1118.07 1168.94 1199.21 1181.40 1199.63 1194.90 1164.42 1178.28 1202.25 1222.24 1224.27 1225.91 1191.96 1237.37 1262.07 1278.72 1276.65 1293.83 1302.18 1290.00 1253.12 1260.24 1287.15 1317.81 1363.38 1388.63 1416.42 1424.16 1444.65 1406.95 1463.65 1511.14 1514.49 1520.98 1454.62 1497.12 1539.66 1463.39 1479.23 1378.76 1354.87 1316.94 1370.47 1403.22 1341.25 1257.33 1281.47 1216.93 969.13 883.04 877.42 865.58 805.23 757.13 848.30 902.41 926.11 935.82 1009.72 1044.55 | |||||||||||||||||||||||||||||||||||||||||
Tables (Output of Computation) | |||||||||||||||||||||||||||||||||||||||||
| |||||||||||||||||||||||||||||||||||||||||
Figures (Output of Computation) | |||||||||||||||||||||||||||||||||||||||||
Input Parameters & R Code | |||||||||||||||||||||||||||||||||||||||||
| Parameters (Session): | |||||||||||||||||||||||||||||||||||||||||
| par1 = maandgemiddelden NY SP-500 index ; par2 = Belgostat (NBB) ; par3 = maandgemiddelden NY SP-500 index(09-2004 tem 09-2009 ; | |||||||||||||||||||||||||||||||||||||||||
| Parameters (R input): | |||||||||||||||||||||||||||||||||||||||||
| par1 = maandgemiddelden NY SP-500 index ; par2 = Belgostat (NBB) ; par3 = maandgemiddelden NY SP-500 index(09-2004 tem 09-2009 ; | |||||||||||||||||||||||||||||||||||||||||
| R code (references can be found in the software module): | |||||||||||||||||||||||||||||||||||||||||
bitmap(file='test1.png') | |||||||||||||||||||||||||||||||||||||||||