Free Statistics
of Irreproducible Research!
Description of Statistical Computation | |||||||||||||||||||||||||||||||||||||||||
|---|---|---|---|---|---|---|---|---|---|---|---|---|---|---|---|---|---|---|---|---|---|---|---|---|---|---|---|---|---|---|---|---|---|---|---|---|---|---|---|---|---|
| Author's title | |||||||||||||||||||||||||||||||||||||||||
| Author | *Unverified author* | ||||||||||||||||||||||||||||||||||||||||
| R Software Module | rwasp_univariatedataseries.wasp | ||||||||||||||||||||||||||||||||||||||||
| Title produced by software | Univariate Data Series | ||||||||||||||||||||||||||||||||||||||||
| Date of computation | Wed, 07 Oct 2009 09:37:30 -0600 | ||||||||||||||||||||||||||||||||||||||||
| Cite this page as follows | Statistical Computations at FreeStatistics.org, Office for Research Development and Education, URL https://freestatistics.org/blog/index.php?v=date/2009/Oct/07/t1254929893jf2js1ea9ktocgi.htm/, Retrieved Sun, 28 Apr 2024 17:24:15 +0000 | ||||||||||||||||||||||||||||||||||||||||
| Statistical Computations at FreeStatistics.org, Office for Research Development and Education, URL https://freestatistics.org/blog/index.php?pk=44614, Retrieved Sun, 28 Apr 2024 17:24:15 +0000 | |||||||||||||||||||||||||||||||||||||||||
| QR Codes: | |||||||||||||||||||||||||||||||||||||||||
|
| |||||||||||||||||||||||||||||||||||||||||
| Original text written by user: | |||||||||||||||||||||||||||||||||||||||||
| IsPrivate? | No (this computation is public) | ||||||||||||||||||||||||||||||||||||||||
| User-defined keywords | KDGP1W1 | ||||||||||||||||||||||||||||||||||||||||
| Estimated Impact | 115 | ||||||||||||||||||||||||||||||||||||||||
Tree of Dependent Computations | |||||||||||||||||||||||||||||||||||||||||
| Family? (F = Feedback message, R = changed R code, M = changed R Module, P = changed Parameters, D = changed Data) | |||||||||||||||||||||||||||||||||||||||||
| - [Univariate Data Series] [Gemiddelde prijs ...] [2009-10-07 15:37:30] [93f7fd88d04bfc03ecae616214d88989] [Current] | |||||||||||||||||||||||||||||||||||||||||
| Feedback Forum | |||||||||||||||||||||||||||||||||||||||||
Post a new message | |||||||||||||||||||||||||||||||||||||||||
Dataset | |||||||||||||||||||||||||||||||||||||||||
| Dataseries X: | |||||||||||||||||||||||||||||||||||||||||
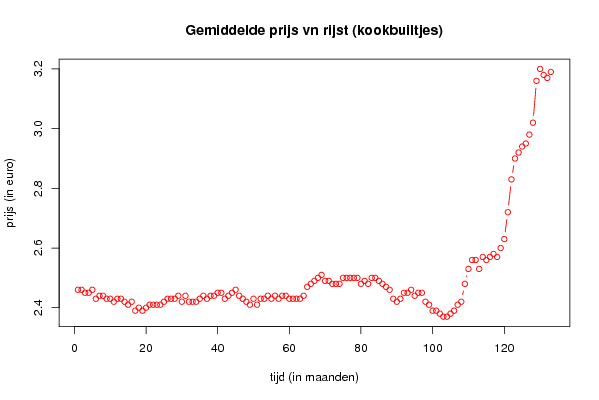
2.46 2.46 2.45 2.45 2.46 2.43 2.44 2.44 2.43 2.43 2.42 2.43 2.43 2.42 2.41 2.42 2.39 2.4 2.39 2.4 2.41 2.41 2.41 2.41 2.42 2.43 2.43 2.43 2.44 2.42 2.44 2.42 2.42 2.42 2.43 2.44 2.43 2.44 2.44 2.45 2.45 2.43 2.44 2.45 2.46 2.44 2.43 2.42 2.41 2.43 2.41 2.43 2.43 2.44 2.43 2.44 2.43 2.44 2.44 2.43 2.43 2.43 2.43 2.44 2.47 2.48 2.49 2.5 2.51 2.49 2.49 2.48 2.48 2.48 2.5 2.5 2.5 2.5 2.5 2.48 2.49 2.48 2.5 2.5 2.49 2.48 2.47 2.46 2.43 2.42 2.43 2.45 2.45 2.46 2.44 2.45 2.45 2.42 2.41 2.39 2.39 2.38 2.37 2.37 2.38 2.39 2.41 2.42 2.48 2.53 2.56 2.56 2.53 2.57 2.56 2.57 2.58 2.57 2.6 2.63 2.72 2.83 2.9 2.92 2.94 2.95 2.98 3.02 3.16 3.2 3.18 3.17 3.19 | |||||||||||||||||||||||||||||||||||||||||
Tables (Output of Computation) | |||||||||||||||||||||||||||||||||||||||||
| |||||||||||||||||||||||||||||||||||||||||
Figures (Output of Computation) | |||||||||||||||||||||||||||||||||||||||||
Input Parameters & R Code | |||||||||||||||||||||||||||||||||||||||||
| Parameters (Session): | |||||||||||||||||||||||||||||||||||||||||
| par1 = gemiddelde consumptieprijs van rijst in kookbuiltjes ; par2 = www.belgostat.be ; | |||||||||||||||||||||||||||||||||||||||||
| Parameters (R input): | |||||||||||||||||||||||||||||||||||||||||
| par1 = gemiddelde consumptieprijs van rijst in kookbuiltjes ; par2 = www.belgostat.be ; par3 = ; | |||||||||||||||||||||||||||||||||||||||||
| R code (references can be found in the software module): | |||||||||||||||||||||||||||||||||||||||||
bitmap(file='test1.png') | |||||||||||||||||||||||||||||||||||||||||