If you paste this QR Code into your document, anyone with a smartphone or tablet will be able to scan it and view this table in a browser.
If you paste this QR Code into your document, anyone with a smartphone or tablet will be able to scan it and view this table in a browser.
If you paste this QR Code into your document, anyone with a smartphone or tablet will be able to scan it and view this table in a browser.
If you paste this QR Code into your document, anyone with a smartphone or tablet will be able to scan it and view this table in a browser.
If you paste this QR Code into your document, anyone with a smartphone or tablet will be able to scan it and view this table in a browser.
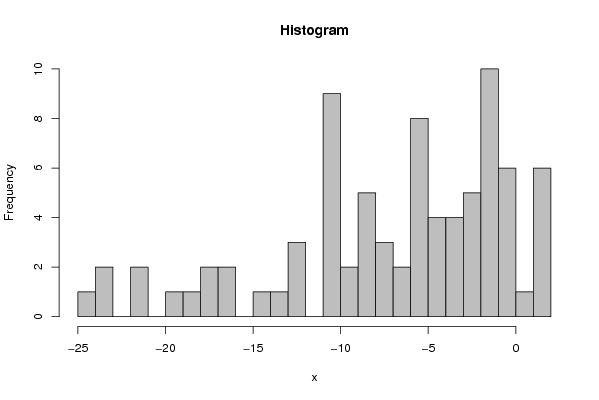
| Frequency Table (Histogram) | | Bins | Midpoint | Abs. Frequency | Rel. Frequency | Cumul. Rel. Freq. | Density | | [-25,-24[ | -24.5 | 1 | 0.012346 | 0.012346 | 0.012346 | | [-24,-23[ | -23.5 | 2 | 0.024691 | 0.037037 | 0.024691 | | [-23,-22[ | -22.5 | 0 | 0 | 0.037037 | 0 | | [-22,-21[ | -21.5 | 2 | 0.024691 | 0.061728 | 0.024691 | | [-21,-20[ | -20.5 | 0 | 0 | 0.061728 | 0 | | [-20,-19[ | -19.5 | 1 | 0.012346 | 0.074074 | 0.012346 | | [-19,-18[ | -18.5 | 1 | 0.012346 | 0.08642 | 0.012346 | | [-18,-17[ | -17.5 | 2 | 0.024691 | 0.111111 | 0.024691 | | [-17,-16[ | -16.5 | 2 | 0.024691 | 0.135802 | 0.024691 | | [-16,-15[ | -15.5 | 0 | 0 | 0.135802 | 0 | | [-15,-14[ | -14.5 | 1 | 0.012346 | 0.148148 | 0.012346 | | [-14,-13[ | -13.5 | 1 | 0.012346 | 0.160494 | 0.012346 | | [-13,-12[ | -12.5 | 3 | 0.037037 | 0.197531 | 0.037037 | | [-12,-11[ | -11.5 | 0 | 0 | 0.197531 | 0 | | [-11,-10[ | -10.5 | 9 | 0.111111 | 0.308642 | 0.111111 | | [-10,-9[ | -9.5 | 2 | 0.024691 | 0.333333 | 0.024691 | | [-9,-8[ | -8.5 | 5 | 0.061728 | 0.395062 | 0.061728 | | [-8,-7[ | -7.5 | 3 | 0.037037 | 0.432099 | 0.037037 | | [-7,-6[ | -6.5 | 2 | 0.024691 | 0.45679 | 0.024691 | | [-6,-5[ | -5.5 | 8 | 0.098765 | 0.555556 | 0.098765 | | [-5,-4[ | -4.5 | 4 | 0.049383 | 0.604938 | 0.049383 | | [-4,-3[ | -3.5 | 4 | 0.049383 | 0.654321 | 0.049383 | | [-3,-2[ | -2.5 | 5 | 0.061728 | 0.716049 | 0.061728 | | [-2,-1[ | -1.5 | 10 | 0.123457 | 0.839506 | 0.123457 | | [-1,0[ | -0.5 | 6 | 0.074074 | 0.91358 | 0.074074 | | [0,1[ | 0.5 | 1 | 0.012346 | 0.925926 | 0.012346 | | [1,2] | 1.5 | 6 | 0.074074 | 1 | 0.074074 |
\begin{tabular}{lllllllll}
\hline
Frequency Table (Histogram) \tabularnewline
Bins & Midpoint & Abs. Frequency & Rel. Frequency & Cumul. Rel. Freq. & Density \tabularnewline
[-25,-24[ & -24.5 & 1 & 0.012346 & 0.012346 & 0.012346 \tabularnewline
[-24,-23[ & -23.5 & 2 & 0.024691 & 0.037037 & 0.024691 \tabularnewline
[-23,-22[ & -22.5 & 0 & 0 & 0.037037 & 0 \tabularnewline
[-22,-21[ & -21.5 & 2 & 0.024691 & 0.061728 & 0.024691 \tabularnewline
[-21,-20[ & -20.5 & 0 & 0 & 0.061728 & 0 \tabularnewline
[-20,-19[ & -19.5 & 1 & 0.012346 & 0.074074 & 0.012346 \tabularnewline
[-19,-18[ & -18.5 & 1 & 0.012346 & 0.08642 & 0.012346 \tabularnewline
[-18,-17[ & -17.5 & 2 & 0.024691 & 0.111111 & 0.024691 \tabularnewline
[-17,-16[ & -16.5 & 2 & 0.024691 & 0.135802 & 0.024691 \tabularnewline
[-16,-15[ & -15.5 & 0 & 0 & 0.135802 & 0 \tabularnewline
[-15,-14[ & -14.5 & 1 & 0.012346 & 0.148148 & 0.012346 \tabularnewline
[-14,-13[ & -13.5 & 1 & 0.012346 & 0.160494 & 0.012346 \tabularnewline
[-13,-12[ & -12.5 & 3 & 0.037037 & 0.197531 & 0.037037 \tabularnewline
[-12,-11[ & -11.5 & 0 & 0 & 0.197531 & 0 \tabularnewline
[-11,-10[ & -10.5 & 9 & 0.111111 & 0.308642 & 0.111111 \tabularnewline
[-10,-9[ & -9.5 & 2 & 0.024691 & 0.333333 & 0.024691 \tabularnewline
[-9,-8[ & -8.5 & 5 & 0.061728 & 0.395062 & 0.061728 \tabularnewline
[-8,-7[ & -7.5 & 3 & 0.037037 & 0.432099 & 0.037037 \tabularnewline
[-7,-6[ & -6.5 & 2 & 0.024691 & 0.45679 & 0.024691 \tabularnewline
[-6,-5[ & -5.5 & 8 & 0.098765 & 0.555556 & 0.098765 \tabularnewline
[-5,-4[ & -4.5 & 4 & 0.049383 & 0.604938 & 0.049383 \tabularnewline
[-4,-3[ & -3.5 & 4 & 0.049383 & 0.654321 & 0.049383 \tabularnewline
[-3,-2[ & -2.5 & 5 & 0.061728 & 0.716049 & 0.061728 \tabularnewline
[-2,-1[ & -1.5 & 10 & 0.123457 & 0.839506 & 0.123457 \tabularnewline
[-1,0[ & -0.5 & 6 & 0.074074 & 0.91358 & 0.074074 \tabularnewline
[0,1[ & 0.5 & 1 & 0.012346 & 0.925926 & 0.012346 \tabularnewline
[1,2] & 1.5 & 6 & 0.074074 & 1 & 0.074074 \tabularnewline
\hline
\end{tabular}
%Source: https://freestatistics.org/blog/index.php?pk=44610&T=1
[TABLE]
[ROW][C]Frequency Table (Histogram)[/C][/ROW]
[ROW][C]Bins[/C][C]Midpoint[/C][C]Abs. Frequency[/C][C]Rel. Frequency[/C][C]Cumul. Rel. Freq.[/C][C]Density[/C][/ROW]
[ROW][C][-25,-24[[/C][C]-24.5[/C][C]1[/C][C]0.012346[/C][C]0.012346[/C][C]0.012346[/C][/ROW]
[ROW][C][-24,-23[[/C][C]-23.5[/C][C]2[/C][C]0.024691[/C][C]0.037037[/C][C]0.024691[/C][/ROW]
[ROW][C][-23,-22[[/C][C]-22.5[/C][C]0[/C][C]0[/C][C]0.037037[/C][C]0[/C][/ROW]
[ROW][C][-22,-21[[/C][C]-21.5[/C][C]2[/C][C]0.024691[/C][C]0.061728[/C][C]0.024691[/C][/ROW]
[ROW][C][-21,-20[[/C][C]-20.5[/C][C]0[/C][C]0[/C][C]0.061728[/C][C]0[/C][/ROW]
[ROW][C][-20,-19[[/C][C]-19.5[/C][C]1[/C][C]0.012346[/C][C]0.074074[/C][C]0.012346[/C][/ROW]
[ROW][C][-19,-18[[/C][C]-18.5[/C][C]1[/C][C]0.012346[/C][C]0.08642[/C][C]0.012346[/C][/ROW]
[ROW][C][-18,-17[[/C][C]-17.5[/C][C]2[/C][C]0.024691[/C][C]0.111111[/C][C]0.024691[/C][/ROW]
[ROW][C][-17,-16[[/C][C]-16.5[/C][C]2[/C][C]0.024691[/C][C]0.135802[/C][C]0.024691[/C][/ROW]
[ROW][C][-16,-15[[/C][C]-15.5[/C][C]0[/C][C]0[/C][C]0.135802[/C][C]0[/C][/ROW]
[ROW][C][-15,-14[[/C][C]-14.5[/C][C]1[/C][C]0.012346[/C][C]0.148148[/C][C]0.012346[/C][/ROW]
[ROW][C][-14,-13[[/C][C]-13.5[/C][C]1[/C][C]0.012346[/C][C]0.160494[/C][C]0.012346[/C][/ROW]
[ROW][C][-13,-12[[/C][C]-12.5[/C][C]3[/C][C]0.037037[/C][C]0.197531[/C][C]0.037037[/C][/ROW]
[ROW][C][-12,-11[[/C][C]-11.5[/C][C]0[/C][C]0[/C][C]0.197531[/C][C]0[/C][/ROW]
[ROW][C][-11,-10[[/C][C]-10.5[/C][C]9[/C][C]0.111111[/C][C]0.308642[/C][C]0.111111[/C][/ROW]
[ROW][C][-10,-9[[/C][C]-9.5[/C][C]2[/C][C]0.024691[/C][C]0.333333[/C][C]0.024691[/C][/ROW]
[ROW][C][-9,-8[[/C][C]-8.5[/C][C]5[/C][C]0.061728[/C][C]0.395062[/C][C]0.061728[/C][/ROW]
[ROW][C][-8,-7[[/C][C]-7.5[/C][C]3[/C][C]0.037037[/C][C]0.432099[/C][C]0.037037[/C][/ROW]
[ROW][C][-7,-6[[/C][C]-6.5[/C][C]2[/C][C]0.024691[/C][C]0.45679[/C][C]0.024691[/C][/ROW]
[ROW][C][-6,-5[[/C][C]-5.5[/C][C]8[/C][C]0.098765[/C][C]0.555556[/C][C]0.098765[/C][/ROW]
[ROW][C][-5,-4[[/C][C]-4.5[/C][C]4[/C][C]0.049383[/C][C]0.604938[/C][C]0.049383[/C][/ROW]
[ROW][C][-4,-3[[/C][C]-3.5[/C][C]4[/C][C]0.049383[/C][C]0.654321[/C][C]0.049383[/C][/ROW]
[ROW][C][-3,-2[[/C][C]-2.5[/C][C]5[/C][C]0.061728[/C][C]0.716049[/C][C]0.061728[/C][/ROW]
[ROW][C][-2,-1[[/C][C]-1.5[/C][C]10[/C][C]0.123457[/C][C]0.839506[/C][C]0.123457[/C][/ROW]
[ROW][C][-1,0[[/C][C]-0.5[/C][C]6[/C][C]0.074074[/C][C]0.91358[/C][C]0.074074[/C][/ROW]
[ROW][C][0,1[[/C][C]0.5[/C][C]1[/C][C]0.012346[/C][C]0.925926[/C][C]0.012346[/C][/ROW]
[ROW][C][1,2][/C][C]1.5[/C][C]6[/C][C]0.074074[/C][C]1[/C][C]0.074074[/C][/ROW]
[/TABLE]
Source: https://freestatistics.org/blog/index.php?pk=44610&T=1
Globally Unique Identifier (entire table): ba.freestatistics.org/blog/index.php?pk=44610&T=1
As an alternative you can also use a QR Code:
The GUIDs for individual cells are displayed in the table below:
| Frequency Table (Histogram) | | Bins | Midpoint | Abs. Frequency | Rel. Frequency | Cumul. Rel. Freq. | Density | | [-25,-24[ | -24.5 | 1 | 0.012346 | 0.012346 | 0.012346 | | [-24,-23[ | -23.5 | 2 | 0.024691 | 0.037037 | 0.024691 | | [-23,-22[ | -22.5 | 0 | 0 | 0.037037 | 0 | | [-22,-21[ | -21.5 | 2 | 0.024691 | 0.061728 | 0.024691 | | [-21,-20[ | -20.5 | 0 | 0 | 0.061728 | 0 | | [-20,-19[ | -19.5 | 1 | 0.012346 | 0.074074 | 0.012346 | | [-19,-18[ | -18.5 | 1 | 0.012346 | 0.08642 | 0.012346 | | [-18,-17[ | -17.5 | 2 | 0.024691 | 0.111111 | 0.024691 | | [-17,-16[ | -16.5 | 2 | 0.024691 | 0.135802 | 0.024691 | | [-16,-15[ | -15.5 | 0 | 0 | 0.135802 | 0 | | [-15,-14[ | -14.5 | 1 | 0.012346 | 0.148148 | 0.012346 | | [-14,-13[ | -13.5 | 1 | 0.012346 | 0.160494 | 0.012346 | | [-13,-12[ | -12.5 | 3 | 0.037037 | 0.197531 | 0.037037 | | [-12,-11[ | -11.5 | 0 | 0 | 0.197531 | 0 | | [-11,-10[ | -10.5 | 9 | 0.111111 | 0.308642 | 0.111111 | | [-10,-9[ | -9.5 | 2 | 0.024691 | 0.333333 | 0.024691 | | [-9,-8[ | -8.5 | 5 | 0.061728 | 0.395062 | 0.061728 | | [-8,-7[ | -7.5 | 3 | 0.037037 | 0.432099 | 0.037037 | | [-7,-6[ | -6.5 | 2 | 0.024691 | 0.45679 | 0.024691 | | [-6,-5[ | -5.5 | 8 | 0.098765 | 0.555556 | 0.098765 | | [-5,-4[ | -4.5 | 4 | 0.049383 | 0.604938 | 0.049383 | | [-4,-3[ | -3.5 | 4 | 0.049383 | 0.654321 | 0.049383 | | [-3,-2[ | -2.5 | 5 | 0.061728 | 0.716049 | 0.061728 | | [-2,-1[ | -1.5 | 10 | 0.123457 | 0.839506 | 0.123457 | | [-1,0[ | -0.5 | 6 | 0.074074 | 0.91358 | 0.074074 | | [0,1[ | 0.5 | 1 | 0.012346 | 0.925926 | 0.012346 | | [1,2] | 1.5 | 6 | 0.074074 | 1 | 0.074074 |
If you paste this QR Code into your document, anyone with a smartphone or tablet will be able to scan it and view this table in a browser.
If you paste this QR Code into your document, anyone with a smartphone or tablet will be able to scan it and view this table in a browser.
If you paste this QR Code into your document, anyone with a smartphone or tablet will be able to scan it and view this table in a browser.
If you paste this QR Code into your document, anyone with a smartphone or tablet will be able to scan it and view this table in a browser.
If you paste this QR Code into your document, anyone with a smartphone or tablet will be able to scan it and view this table in a browser.
|