| Multiple Linear Regression - Estimated Regression Equation |
| Dow [t] = + 4315.15037055132 + 1.91786649769111Bel20[t] -12.0114399264399M1[t] + 33.9335808282130M2[t] + 117.190298734077M3[t] -160.062610981528M4[t] -290.143787633976M5[t] -407.336810825499M6[t] -372.008040407226M7[t] -135.387393105297M8[t] -65.006563773501M9[t] -36.6220102938663M10[t] + 39.5111389175097M11[t] + 12.7266451439576t + e[t] |
| Multiple Linear Regression - Ordinary Least Squares | |||||
| Variable | Parameter | S.D. | T-STAT H0: parameter = 0 | 2-tail p-value | 1-tail p-value |
| (Intercept) | 4315.15037055132 | 468.495622 | 9.2107 | 0 | 0 |
| Bel20 | 1.91786649769111 | 0.091256 | 21.0163 | 0 | 0 |
| M1 | -12.0114399264399 | 355.211874 | -0.0338 | 0.973171 | 0.486586 |
| M2 | 33.9335808282130 | 354.910027 | 0.0956 | 0.924244 | 0.462122 |
| M3 | 117.190298734077 | 354.166217 | 0.3309 | 0.74223 | 0.371115 |
| M4 | -160.062610981528 | 353.523534 | -0.4528 | 0.652847 | 0.326424 |
| M5 | -290.143787633976 | 353.026624 | -0.8219 | 0.415388 | 0.207694 |
| M6 | -407.336810825499 | 352.772292 | -1.1547 | 0.254187 | 0.127094 |
| M7 | -372.008040407226 | 352.230648 | -1.0561 | 0.296416 | 0.148208 |
| M8 | -135.387393105297 | 352.00662 | -0.3846 | 0.702294 | 0.351147 |
| M9 | -65.006563773501 | 351.894068 | -0.1847 | 0.85425 | 0.427125 |
| M10 | -36.6220102938663 | 351.862776 | -0.1041 | 0.917558 | 0.458779 |
| M11 | 39.5111389175097 | 351.685546 | 0.1123 | 0.911036 | 0.455518 |
| t | 12.7266451439576 | 4.519599 | 2.8159 | 0.00714 | 0.00357 |
| Multiple Linear Regression - Regression Statistics | |
| Multiple R | 0.954439759066023 |
| R-squared | 0.910955253686008 |
| Adjusted R-squared | 0.885790434075532 |
| F-TEST (value) | 36.1995542899415 |
| F-TEST (DF numerator) | 13 |
| F-TEST (DF denominator) | 46 |
| p-value | 0 |
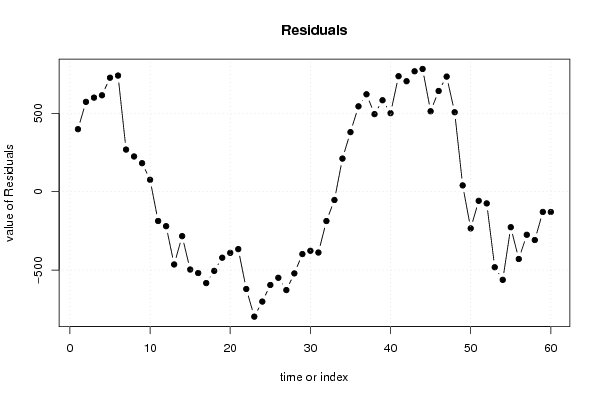
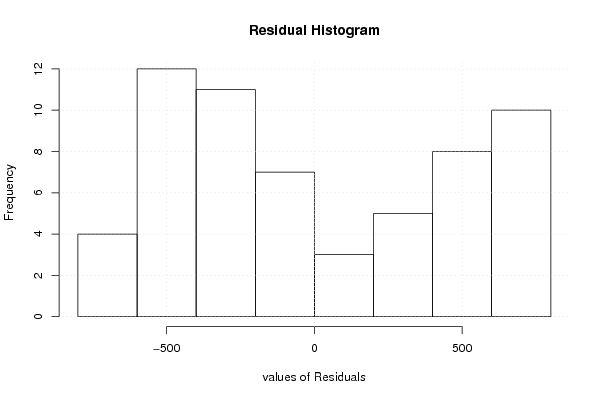
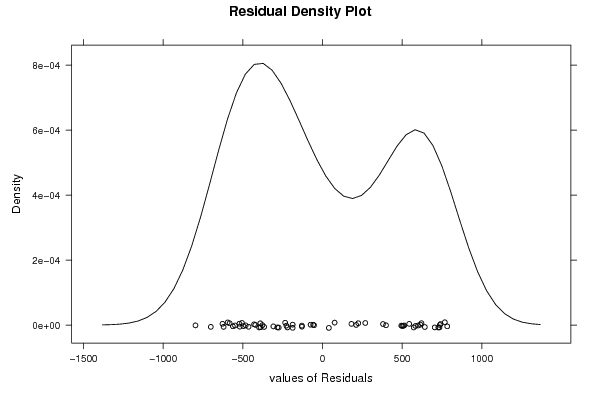
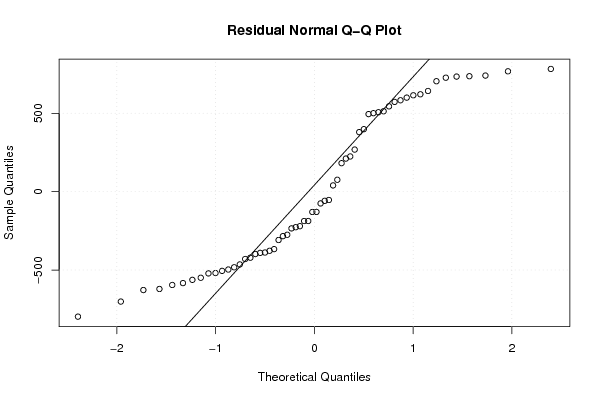
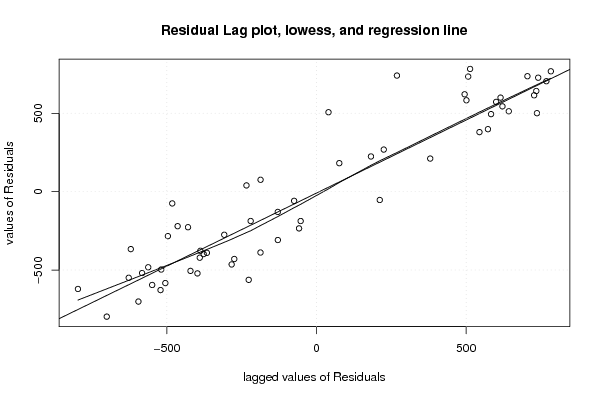
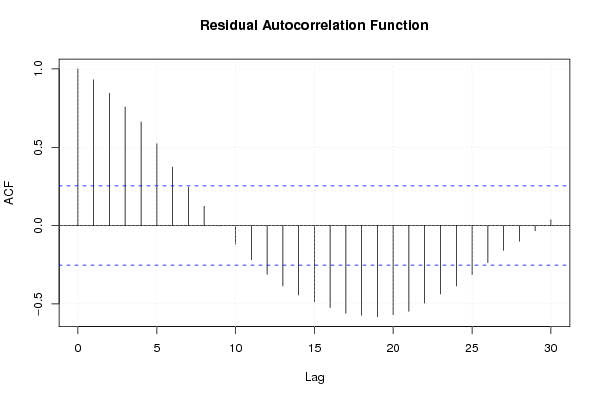
| Multiple Linear Regression - Residual Statistics | |
| Residual Standard Deviation | 555.918609004132 |
| Sum Squared Residuals | 14216092.9925061 |
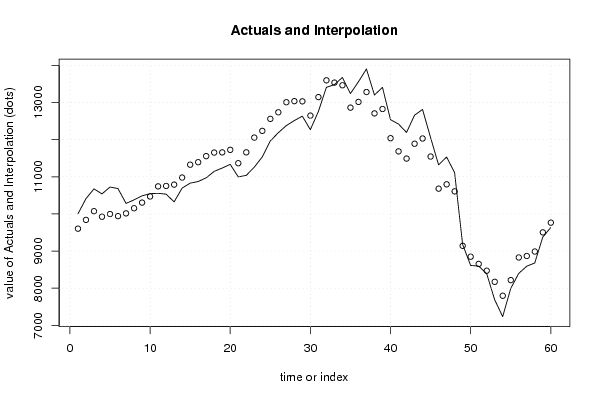
| Multiple Linear Regression - Actuals, Interpolation, and Residuals | |||
| Time or Index | Actuals | Interpolation Forecast | Residuals Prediction Error |
| 1 | 10001.6 | 9602.96322194372 | 398.636778056275 |
| 2 | 10411.75 | 9839.05671754377 | 572.693282456226 |
| 3 | 10673.38 | 10073.4525057320 | 599.927494268031 |
| 4 | 10539.51 | 9924.78455628584 | 614.72544371416 |
| 5 | 10723.78 | 9996.7809840944 | 726.999015905608 |
| 6 | 10682.06 | 9941.48870304763 | 740.571296952373 |
| 7 | 10283.19 | 10014.6489910646 | 268.541008935366 |
| 8 | 10377.18 | 10152.6641333196 | 224.515866680448 |
| 9 | 10486.64 | 10304.9106950371 | 181.729304962929 |
| 10 | 10545.38 | 10469.4941387820 | 75.885861217983 |
| 11 | 10554.27 | 10741.4526476719 | -187.182647671919 |
| 12 | 10532.54 | 10752.7378038775 | -220.197803877536 |
| 13 | 10324.31 | 10788.5691446678 | -464.259144667778 |
| 14 | 10695.25 | 10978.9407029628 | -283.690702962836 |
| 15 | 10827.81 | 11324.5919266821 | -496.781926682086 |
| 16 | 10872.48 | 11391.5880649013 | -519.108064901324 |
| 17 | 10971.19 | 11554.2995780507 | -583.109578050664 |
| 18 | 11145.65 | 11651.0173956109 | -505.367395610897 |
| 19 | 11234.68 | 11656.0167083000 | -421.336708299961 |
| 20 | 11333.88 | 11724.2215100389 | -390.341510038924 |
| 21 | 10997.97 | 11364.4168955379 | -366.446895537893 |
| 22 | 11036.89 | 11657.7083599429 | -620.818359942889 |
| 23 | 11257.35 | 12054.6925858173 | -797.342585817275 |
| 24 | 11533.59 | 12234.7116364898 | -701.121636489755 |
| 25 | 11963.12 | 12558.4339172484 | -595.313917248409 |
| 26 | 12185.15 | 12734.5365488006 | -549.386548800646 |
| 27 | 12377.62 | 13005.3142644500 | -627.694264450035 |
| 28 | 12512.89 | 13034.2599313551 | -521.36993135508 |
| 29 | 12631.48 | 13029.541699256 | -398.061699255989 |
| 30 | 12268.53 | 12645.7188871547 | -377.188887154735 |
| 31 | 12754.8 | 13143.1112444610 | -388.311244461017 |
| 32 | 13407.75 | 13595.1578470479 | -187.407847047875 |
| 33 | 13480.21 | 13533.3513289581 | -53.1413289580891 |
| 34 | 13673.28 | 13462.1522654769 | 211.127734523110 |
| 35 | 13239.71 | 12859.9664033842 | 379.743596615834 |
| 36 | 13557.69 | 13013.4038243986 | 544.286175601355 |
| 37 | 13901.28 | 13280.2038275058 | 621.076172494174 |
| 38 | 13200.58 | 12705.8836558415 | 494.696344158511 |
| 39 | 13406.97 | 12823.9224836148 | 583.047516385241 |
| 40 | 12538.12 | 12037.3721370366 | 500.747862963433 |
| 41 | 12419.57 | 11683.1419143982 | 736.42808560175 |
| 42 | 12193.88 | 11489.3413148882 | 704.538685111767 |
| 43 | 12656.63 | 11888.7882301574 | 767.841769842572 |
| 44 | 12812.48 | 12029.6609934939 | 782.819006506095 |
| 45 | 12056.67 | 11543.7566567697 | 512.913343230316 |
| 46 | 11322.38 | 10680.0759777775 | 642.304022222455 |
| 47 | 11530.75 | 10796.6105856946 | 734.13941430544 |
| 48 | 11114.08 | 10607.4019782315 | 506.678021768451 |
| 49 | 9181.73 | 9141.86988863426 | 39.8601113657374 |
| 50 | 8614.55 | 8848.86237485125 | -234.312374851255 |
| 51 | 8595.56 | 8654.05881952115 | -58.4988195211513 |
| 52 | 8396.2 | 8471.19531042119 | -74.9953104211893 |
| 53 | 7690.5 | 8172.7558242007 | -482.255824200705 |
| 54 | 7235.47 | 7798.02369929851 | -562.553699298509 |
| 55 | 7992.12 | 8218.85482601696 | -226.73482601696 |
| 56 | 8398.37 | 8827.95551609974 | -429.585516099744 |
| 57 | 8593.01 | 8868.06442369726 | -275.054423697263 |
| 58 | 8679.75 | 8988.24925802066 | -308.49925802066 |
| 59 | 9374.63 | 9503.98777743208 | -129.357777432080 |
| 60 | 9634.97 | 9764.61475700252 | -129.644757002518 |
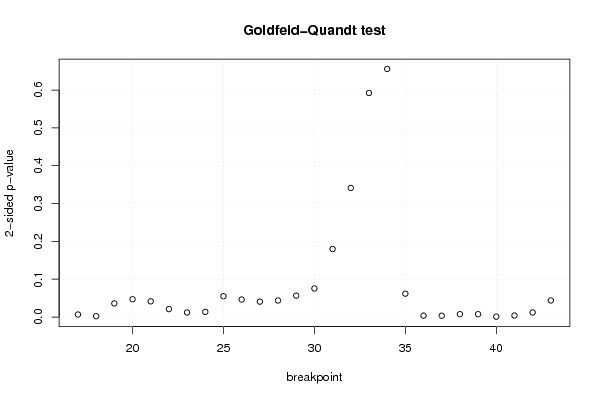
| Goldfeld-Quandt test for Heteroskedasticity | |||
| p-values | Alternative Hypothesis | ||
| breakpoint index | greater | 2-sided | less |
| 17 | 0.00329953395434436 | 0.00659906790868872 | 0.996700466045656 |
| 18 | 0.00105575254545439 | 0.00211150509090878 | 0.998944247454546 |
| 19 | 0.0179772612681773 | 0.0359545225363546 | 0.982022738731823 |
| 20 | 0.0235340486588837 | 0.0470680973177673 | 0.976465951341116 |
| 21 | 0.0207264871124536 | 0.0414529742249072 | 0.979273512887546 |
| 22 | 0.0104803397418398 | 0.0209606794836795 | 0.98951966025816 |
| 23 | 0.00600819552201116 | 0.0120163910440223 | 0.993991804477989 |
| 24 | 0.00680046239140797 | 0.0136009247828159 | 0.993199537608592 |
| 25 | 0.0275038666077415 | 0.055007733215483 | 0.972496133392258 |
| 26 | 0.0230752728171869 | 0.0461505456343737 | 0.976924727182813 |
| 27 | 0.0203312700953431 | 0.0406625401906861 | 0.979668729904657 |
| 28 | 0.0218357303186767 | 0.0436714606373533 | 0.978164269681323 |
| 29 | 0.0282733880118983 | 0.0565467760237965 | 0.971726611988102 |
| 30 | 0.0377427899514072 | 0.0754855799028143 | 0.962257210048593 |
| 31 | 0.0898752285194427 | 0.179750457038885 | 0.910124771480557 |
| 32 | 0.170643424533418 | 0.341286849066836 | 0.829356575466582 |
| 33 | 0.29618699254754 | 0.59237398509508 | 0.70381300745246 |
| 34 | 0.67206797775608 | 0.65586404448784 | 0.32793202224392 |
| 35 | 0.969116332688274 | 0.0617673346234511 | 0.0308836673117256 |
| 36 | 0.998180850746 | 0.00363829850800184 | 0.00181914925400092 |
| 37 | 0.99828482133908 | 0.00343035732183853 | 0.00171517866091926 |
| 38 | 0.996271271924832 | 0.0074574561503354 | 0.0037287280751677 |
| 39 | 0.996280071091943 | 0.00743985781611394 | 0.00371992890805697 |
| 40 | 0.99952709814567 | 0.000945803708660037 | 0.000472901854330018 |
| 41 | 0.998059920302892 | 0.00388015939421543 | 0.00194007969710771 |
| 42 | 0.99399939936836 | 0.0120012012632780 | 0.00600060063163902 |
| 43 | 0.97810855371872 | 0.0437828925625585 | 0.0218914462812793 |
| Meta Analysis of Goldfeld-Quandt test for Heteroskedasticity | |||
| Description | # significant tests | % significant tests | OK/NOK |
| 1% type I error level | 8 | 0.296296296296296 | NOK |
| 5% type I error level | 19 | 0.703703703703704 | NOK |
| 10% type I error level | 23 | 0.851851851851852 | NOK |