| Multiple Linear Regression - Estimated Regression Equation |
| Dow [t] = + 4917.93272132236 + 1.82235335164621Bel20[t] + e[t] |
| Multiple Linear Regression - Ordinary Least Squares | |||||
| Variable | Parameter | S.D. | T-STAT H0: parameter = 0 | 2-tail p-value | 1-tail p-value |
| (Intercept) | 4917.93272132236 | 299.406265 | 16.4256 | 0 | 0 |
| Bel20 | 1.82235335164621 | 0.086177 | 21.1467 | 0 | 0 |
| Multiple Linear Regression - Regression Statistics | |
| Multiple R | 0.940845637839431 |
| R-squared | 0.885190514241486 |
| Adjusted R-squared | 0.883211040349098 |
| F-TEST (value) | 447.184738149556 |
| F-TEST (DF numerator) | 1 |
| F-TEST (DF denominator) | 58 |
| p-value | 0 |
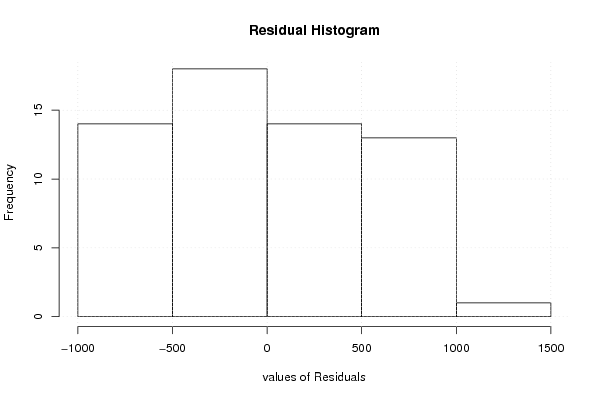
| Multiple Linear Regression - Residual Statistics | |
| Residual Standard Deviation | 562.16119851205 |
| Sum Squared Residuals | 18329462.3605253 |
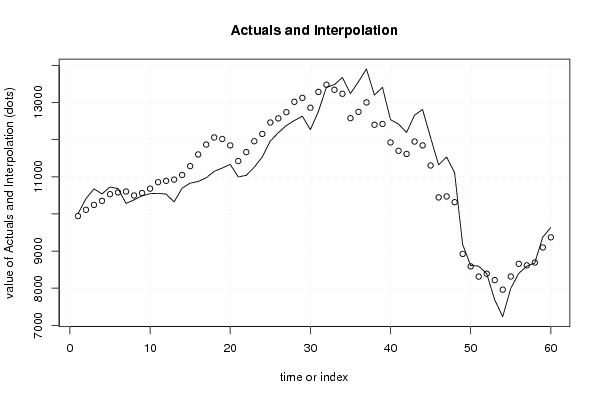
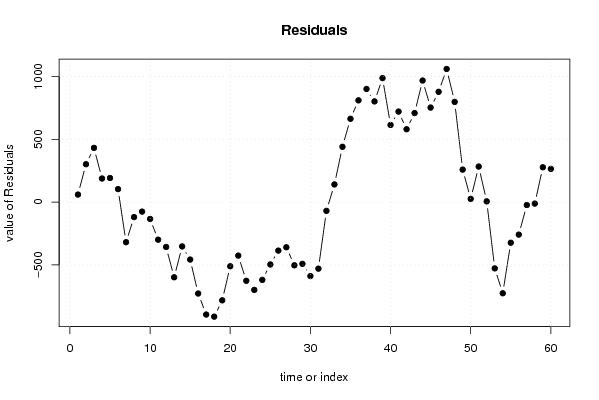
| Multiple Linear Regression - Actuals, Interpolation, and Residuals | |||
| Time or Index | Actuals | Interpolation Forecast | Residuals Prediction Error |
| 1 | 10001.6 | 9941.72354700654 | 59.8764529934612 |
| 2 | 10411.75 | 10110.3094555674 | 301.440544432635 |
| 3 | 10673.38 | 10241.8286969557 | 431.551303044322 |
| 4 | 10539.51 | 10351.9170629286 | 187.592937071376 |
| 5 | 10723.78 | 10531.8380093367 | 191.941990663345 |
| 6 | 10682.06 | 10578.5631492729 | 103.496850727135 |
| 7 | 10283.19 | 10602.4177546459 | -319.227754645913 |
| 8 | 10377.18 | 10496.6301425829 | -119.450142582851 |
| 9 | 10486.64 | 10562.3259809097 | -75.6859809096972 |
| 10 | 10545.38 | 10679.6490896887 | -134.269089688681 |
| 11 | 10554.27 | 10853.6291641703 | -299.359164170343 |
| 12 | 10532.54 | 10889.8028782005 | -357.262878200521 |
| 13 | 10324.31 | 10923.1701680692 | -598.860168069165 |
| 14 | 10695.25 | 11048.3111727267 | -353.061172726709 |
| 15 | 10827.81 | 11285.545132044 | -457.735132044014 |
| 16 | 10872.48 | 11600.5571324096 | -728.077132409579 |
| 17 | 10971.19 | 11866.6753923505 | -895.485392350474 |
| 18 | 11145.65 | 12057.8402589382 | -912.190258938163 |
| 19 | 11234.68 | 12016.9284261937 | -782.248426193705 |
| 20 | 11333.88 | 11844.8071521307 | -510.927152130721 |
| 21 | 10997.97 | 11423.9528691015 | -425.982869101544 |
| 22 | 11036.89 | 11663.5741113095 | -626.684111309505 |
| 23 | 11257.35 | 11956.3534007850 | -699.003400784985 |
| 24 | 11533.59 | 12152.857762693 | -619.267762692996 |
| 25 | 11963.12 | 12459.7785141773 | -496.658514177252 |
| 26 | 12185.15 | 12571.3612098985 | -386.211209898549 |
| 27 | 12377.62 | 12737.4504943676 | -359.830494367585 |
| 28 | 12512.89 | 13016.3070042365 | -503.417004236489 |
| 29 | 12631.48 | 13123.3338165787 | -491.853816578672 |
| 30 | 12268.53 | 12857.8898273779 | -589.359827377882 |
| 31 | 12754.8 | 13284.8489941351 | -530.048994135077 |
| 32 | 13407.75 | 13477.4535198706 | -69.7035198705634 |
| 33 | 13480.21 | 13339.7565006202 | 140.453499379824 |
| 34 | 13673.28 | 13233.0394883478 | 440.240511652227 |
| 35 | 13239.71 | 12576.4091286826 | 663.300871317389 |
| 36 | 13557.69 | 12747.6556731368 | 810.034326863197 |
| 37 | 13901.28 | 13000.4889771442 | 900.791022855802 |
| 38 | 13200.58 | 12399.0212534334 | 801.558746566633 |
| 39 | 13406.97 | 12419.9783169773 | 986.991683022701 |
| 40 | 12538.12 | 11923.9519581927 | 614.168041807286 |
| 41 | 12419.57 | 11698.8730957309 | 720.696904269108 |
| 42 | 12193.88 | 11613.9878766112 | 579.892123388788 |
| 43 | 12656.63 | 11947.8794576998 | 708.75054230017 |
| 44 | 12812.48 | 11844.8071521307 | 967.67284786928 |
| 45 | 12056.67 | 11304.1331362308 | 752.536863769195 |
| 46 | 11322.38 | 10444.4014955247 | 877.978504475329 |
| 47 | 11530.75 | 10470.6980543889 | 1060.05194561107 |
| 48 | 11114.08 | 10316.362949038 | 797.717050961992 |
| 49 | 9181.73 | 8923.13736463744 | 258.592635362556 |
| 50 | 8614.55 | 8588.97243054608 | 25.5775694539222 |
| 51 | 8595.56 | 8312.66721536948 | 282.892784630521 |
| 52 | 8396.2 | 8390.26302108257 | 5.93697891742667 |
| 53 | 7690.5 | 8218.19641762014 | -527.696417620138 |
| 54 | 7235.47 | 7961.39038330615 | -725.920383306153 |
| 55 | 7992.12 | 8315.60120426563 | -323.481204265629 |
| 56 | 8398.37 | 8657.43824596743 | -259.068245967425 |
| 57 | 8593.01 | 8616.58108382352 | -23.5710838235165 |
| 58 | 8679.75 | 8691.71671251189 | -11.9667125118907 |
| 59 | 9374.63 | 9097.3361215213 | 277.293878478694 |
| 60 | 9634.97 | 9370.433994799 | 264.536005200993 |
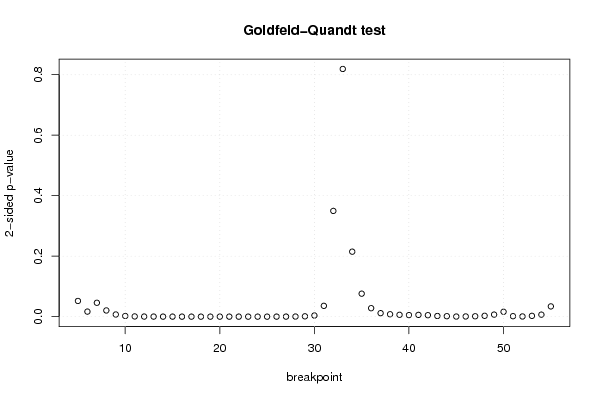
| Goldfeld-Quandt test for Heteroskedasticity | |||
| p-values | Alternative Hypothesis | ||
| breakpoint index | greater | 2-sided | less |
| 5 | 0.0259618272747727 | 0.0519236545495454 | 0.974038172725227 |
| 6 | 0.00835126558638588 | 0.0167025311727718 | 0.991648734413614 |
| 7 | 0.0229490776880301 | 0.0458981553760602 | 0.97705092231197 |
| 8 | 0.0102566436469389 | 0.0205132872938778 | 0.989743356353061 |
| 9 | 0.00356841218212355 | 0.00713682436424711 | 0.996431587817876 |
| 10 | 0.00115061112900905 | 0.00230122225801810 | 0.99884938887099 |
| 11 | 0.000390649043447764 | 0.000781298086895529 | 0.999609350956552 |
| 12 | 0.000130592949265558 | 0.000261185898531117 | 0.999869407050734 |
| 13 | 0.000104752772896403 | 0.000209505545792807 | 0.999895247227104 |
| 14 | 3.48255859290535e-05 | 6.9651171858107e-05 | 0.99996517441407 |
| 15 | 1.28562904762731e-05 | 2.57125809525463e-05 | 0.999987143709524 |
| 16 | 4.43191999286247e-06 | 8.86383998572493e-06 | 0.999995568080007 |
| 17 | 1.75876532809935e-06 | 3.51753065619869e-06 | 0.999998241234672 |
| 18 | 9.12240921493083e-07 | 1.82448184298617e-06 | 0.999999087759079 |
| 19 | 6.03598741576539e-07 | 1.20719748315308e-06 | 0.999999396401258 |
| 20 | 7.79364428420168e-07 | 1.55872885684034e-06 | 0.999999220635572 |
| 21 | 3.27823519663107e-07 | 6.55647039326214e-07 | 0.99999967217648 |
| 22 | 1.46369988589294e-07 | 2.92739977178587e-07 | 0.999999853630011 |
| 23 | 9.53428539438808e-08 | 1.90685707887762e-07 | 0.999999904657146 |
| 24 | 1.57105203837021e-07 | 3.14210407674043e-07 | 0.999999842894796 |
| 25 | 1.48033885076120e-06 | 2.96067770152239e-06 | 0.99999851966115 |
| 26 | 1.24888557454121e-05 | 2.49777114908242e-05 | 0.999987511144255 |
| 27 | 6.14864548042761e-05 | 0.000122972909608552 | 0.999938513545196 |
| 28 | 0.000173604195655737 | 0.000347208391311474 | 0.999826395804344 |
| 29 | 0.000544329545920756 | 0.00108865909184151 | 0.99945567045408 |
| 30 | 0.00188118299873136 | 0.00376236599746272 | 0.998118817001269 |
| 31 | 0.0178923026905337 | 0.0357846053810674 | 0.982107697309466 |
| 32 | 0.174826021828398 | 0.349652043656796 | 0.825173978171602 |
| 33 | 0.590479498573433 | 0.819041002853134 | 0.409520501426567 |
| 34 | 0.892562508625755 | 0.214874982748489 | 0.107437491374245 |
| 35 | 0.962008742605908 | 0.0759825147881841 | 0.0379912573940921 |
| 36 | 0.986029250187099 | 0.0279414996258028 | 0.0139707498129014 |
| 37 | 0.994235665824382 | 0.0115286683512361 | 0.00576433417561803 |
| 38 | 0.996029006162244 | 0.00794198767551256 | 0.00397099383775628 |
| 39 | 0.996935201574452 | 0.0061295968510952 | 0.0030647984255476 |
| 40 | 0.99737186957427 | 0.00525626085146005 | 0.00262813042573003 |
| 41 | 0.997072065542604 | 0.00585586891479137 | 0.00292793445739568 |
| 42 | 0.997583650667385 | 0.00483269866522957 | 0.00241634933261479 |
| 43 | 0.998903153587368 | 0.00219369282526378 | 0.00109684641263189 |
| 44 | 0.999245877623049 | 0.00150824475390245 | 0.000754122376951223 |
| 45 | 0.99983246389211 | 0.000335072215779261 | 0.000167536107889631 |
| 46 | 0.99966579087919 | 0.000668418241619215 | 0.000334209120809608 |
| 47 | 0.999344838283781 | 0.00131032343243818 | 0.000655161716219088 |
| 48 | 0.99860199304713 | 0.00279601390573988 | 0.00139800695286994 |
| 49 | 0.996615602194608 | 0.00676879561078458 | 0.00338439780539229 |
| 50 | 0.991934927863503 | 0.016130144272993 | 0.0080650721364965 |
| 51 | 0.999213345565845 | 0.00157330886831008 | 0.000786654434155039 |
| 52 | 0.999682442731405 | 0.000635114537190204 | 0.000317557268595102 |
| 53 | 0.998697245522438 | 0.00260550895512381 | 0.00130275447756190 |
| 54 | 0.996691189635801 | 0.00661762072839725 | 0.00330881036419862 |
| 55 | 0.983040637131942 | 0.0339187257361151 | 0.0169593628680576 |
| Meta Analysis of Goldfeld-Quandt test for Heteroskedasticity | |||
| Description | # significant tests | % significant tests | OK/NOK |
| 1% type I error level | 38 | 0.745098039215686 | NOK |
| 5% type I error level | 46 | 0.901960784313726 | NOK |
| 10% type I error level | 48 | 0.941176470588235 | NOK |