| Multiple Linear Regression - Estimated Regression Equation |
| Y[t] = -94720.9605158426 + 0.592327661009512X[t] + 0.895766698514853Y1[t] -0.417564650909098Y2[t] + 0.270154944508241Y3[t] -0.157692651463375Y4[t] + 12851.7566275878M1[t] + 8051.82719716753M2[t] + 15042.7024308202M3[t] + 19434.5168649013M4[t] + 18108.0290237541M5[t] + 18650.3443112222M6[t] + 17673.7431743616M7[t] + 20418.5457150754M8[t] + 17570.7707595111M9[t] + 18101.5818362902M10[t] + 20103.1448944525M11[t] + 520.055780191044t + e[t] |
| Multiple Linear Regression - Ordinary Least Squares | |||||
| Variable | Parameter | S.D. | T-STAT H0: parameter = 0 | 2-tail p-value | 1-tail p-value |
| (Intercept) | -94720.9605158426 | 31536.948962 | -3.0035 | 0.004436 | 0.002218 |
| X | 0.592327661009512 | 0.167347 | 3.5395 | 0.000977 | 0.000489 |
| Y1 | 0.895766698514853 | 0.161767 | 5.5374 | 2e-06 | 1e-06 |
| Y2 | -0.417564650909098 | 0.181553 | -2.3 | 0.026368 | 0.013184 |
| Y3 | 0.270154944508241 | 0.152407 | 1.7726 | 0.083382 | 0.041691 |
| Y4 | -0.157692651463375 | 0.108262 | -1.4566 | 0.152496 | 0.076248 |
| M1 | 12851.7566275878 | 4884.982635 | 2.6309 | 0.011774 | 0.005887 |
| M2 | 8051.82719716753 | 5756.921631 | 1.3986 | 0.169094 | 0.084547 |
| M3 | 15042.7024308202 | 6456.137052 | 2.33 | 0.024569 | 0.012285 |
| M4 | 19434.5168649013 | 5730.215284 | 3.3916 | 0.001501 | 0.00075 |
| M5 | 18108.0290237541 | 5142.977154 | 3.5209 | 0.001032 | 0.000516 |
| M6 | 18650.3443112222 | 5874.301648 | 3.1749 | 0.00277 | 0.001385 |
| M7 | 17673.7431743616 | 6624.66122 | 2.6679 | 0.01072 | 0.00536 |
| M8 | 20418.5457150754 | 6768.681744 | 3.0166 | 0.004281 | 0.002141 |
| M9 | 17570.7707595111 | 7007.172136 | 2.5075 | 0.016013 | 0.008007 |
| M10 | 18101.5818362902 | 6211.4447 | 2.9142 | 0.005639 | 0.00282 |
| M11 | 20103.1448944525 | 3929.6852 | 5.1157 | 7e-06 | 3e-06 |
| t | 520.055780191044 | 154.667602 | 3.3624 | 0.001632 | 0.000816 |
| Multiple Linear Regression - Regression Statistics | |
| Multiple R | 0.985124369674081 |
| R-squared | 0.970470023725756 |
| Adjusted R-squared | 0.958795381942916 |
| F-TEST (value) | 83.1263212848346 |
| F-TEST (DF numerator) | 17 |
| F-TEST (DF denominator) | 43 |
| p-value | 0 |
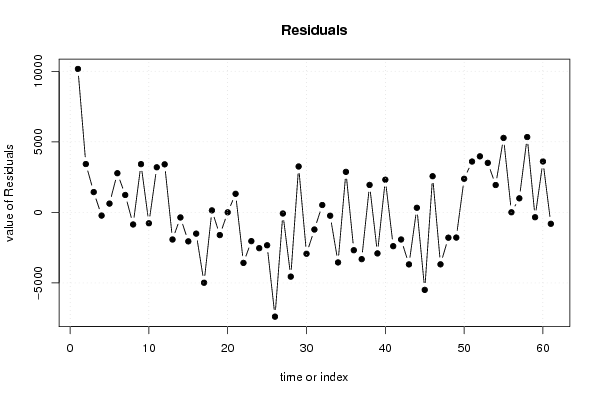
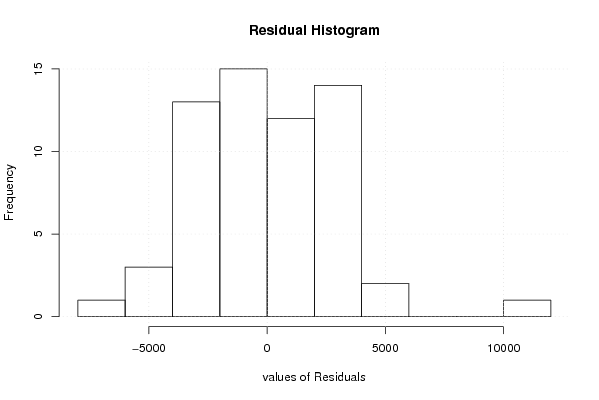
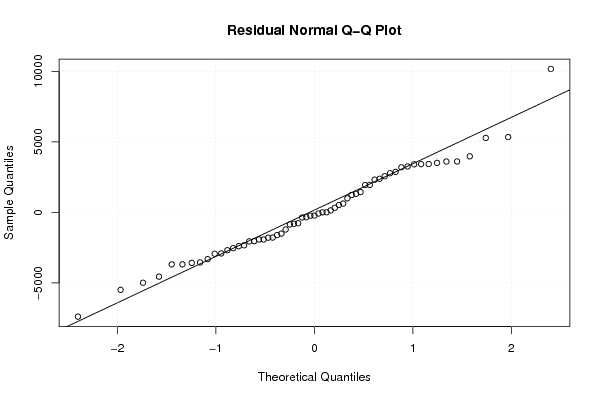
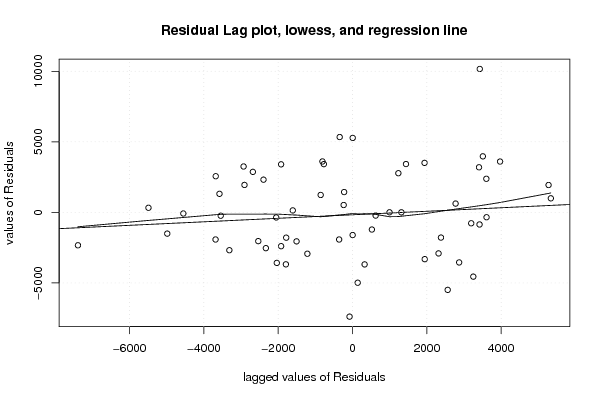
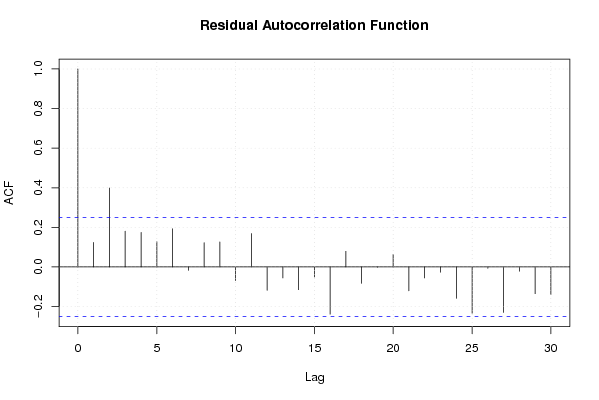
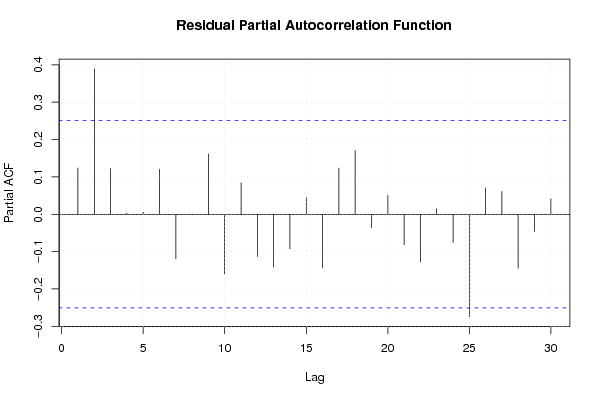
| Multiple Linear Regression - Residual Statistics | |
| Residual Standard Deviation | 3685.96446459631 |
| Sum Squared Residuals | 584212363.473471 |
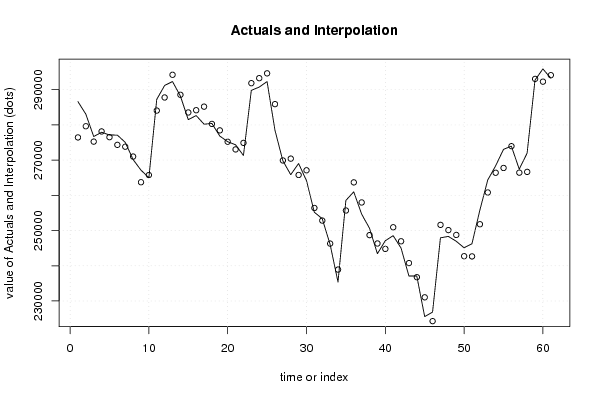
| Multiple Linear Regression - Actuals, Interpolation, and Residuals | |||
| Time or Index | Actuals | Interpolation Forecast | Residuals Prediction Error |
| 1 | 286602 | 276438.642945773 | 10163.3570542271 |
| 2 | 283042 | 279617.252499239 | 3424.74750076138 |
| 3 | 276687 | 275247.433621603 | 1439.56637839672 |
| 4 | 277915 | 278141.373382996 | -226.373382995589 |
| 5 | 277128 | 276504.908751473 | 623.09124852682 |
| 6 | 277103 | 274328.702490210 | 2774.29750979044 |
| 7 | 275037 | 273803.408116236 | 1233.59188376398 |
| 8 | 270150 | 271006.610572395 | -856.610572394643 |
| 9 | 267140 | 263721.127294147 | 3418.87270585261 |
| 10 | 264993 | 265765.043609807 | -772.043609807469 |
| 11 | 287259 | 284064.585417578 | 3194.41458242155 |
| 12 | 291186 | 287781.433907464 | 3404.56609253556 |
| 13 | 292300 | 294222.009188872 | -1922.00918887193 |
| 14 | 288186 | 288545.555114005 | -359.555114005374 |
| 15 | 281477 | 283530.202877907 | -2053.20287790750 |
| 16 | 282656 | 284162.447686412 | -1506.44768641232 |
| 17 | 280190 | 285175.999604018 | -4985.99960401816 |
| 18 | 280408 | 280268.246807905 | 139.753192095442 |
| 19 | 276836 | 278443.978042471 | -1607.97804247134 |
| 20 | 275216 | 275212.096768299 | 3.90323170146075 |
| 21 | 274352 | 273037.282874659 | 1314.71712534145 |
| 22 | 271311 | 274891.478715301 | -3580.47871530065 |
| 23 | 289802 | 291840.020437621 | -2038.02043762125 |
| 24 | 290726 | 293262.414173577 | -2536.41417357664 |
| 25 | 292300 | 294632.52167068 | -2332.52167067987 |
| 26 | 278506 | 285895.448752782 | -7389.44875278206 |
| 27 | 269826 | 269906.153408989 | -80.1534089887796 |
| 28 | 265861 | 270414.91988997 | -4553.91988997006 |
| 29 | 269034 | 265782.918769614 | 3251.08123038630 |
| 30 | 264176 | 267107.7318633 | -2931.73186329997 |
| 31 | 255198 | 256413.363304377 | -1215.36330437660 |
| 32 | 253353 | 252831.601455222 | 521.39854477773 |
| 33 | 246057 | 246294.511344679 | -237.51134467947 |
| 34 | 235372 | 238919.264884460 | -3547.26488445952 |
| 35 | 258556 | 255685.95088083 | 2870.04911917025 |
| 36 | 260993 | 263674.977140295 | -2681.97714029476 |
| 37 | 254663 | 257977.865645282 | -3314.86564528209 |
| 38 | 250643 | 248699.275559666 | 1943.72444033395 |
| 39 | 243422 | 246329.776260896 | -2907.77626089623 |
| 40 | 247105 | 244789.35411637 | 2315.64588363029 |
| 41 | 248541 | 250936.815124818 | -2395.81512481807 |
| 42 | 245039 | 246960.304400980 | -1921.30440098034 |
| 43 | 237080 | 240766.393450401 | -3686.3934504008 |
| 44 | 237085 | 236759.207346437 | 325.792653562820 |
| 45 | 225554 | 231045.609529229 | -5491.6095292287 |
| 46 | 226839 | 224276.948536537 | 2562.05146346283 |
| 47 | 247934 | 251615.493002461 | -3681.49300246100 |
| 48 | 248333 | 250126.367393348 | -1793.36739334811 |
| 49 | 246969 | 248753.536143747 | -1784.53614374741 |
| 50 | 245098 | 242717.468074308 | 2380.53192569210 |
| 51 | 246263 | 242661.433830604 | 3601.56616939579 |
| 52 | 255765 | 251793.904924252 | 3971.09507574767 |
| 53 | 264319 | 260811.357750077 | 3507.64224992311 |
| 54 | 268347 | 266408.014437606 | 1938.98556239443 |
| 55 | 273046 | 267769.857086515 | 5276.14291348477 |
| 56 | 273963 | 273957.483857647 | 5.51614235262969 |
| 57 | 267430 | 266434.468957286 | 995.53104271411 |
| 58 | 271993 | 266655.264253895 | 5337.7357461048 |
| 59 | 292710 | 293054.950261510 | -344.950261509565 |
| 60 | 295881 | 292273.807385316 | 3607.19261468396 |
| 61 | 293299 | 294108.424405646 | -809.424405645755 |
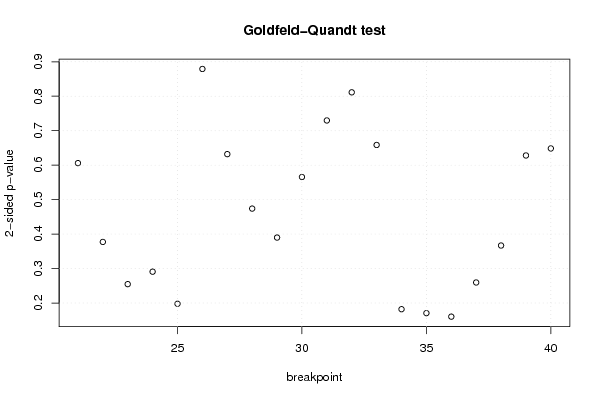
| Goldfeld-Quandt test for Heteroskedasticity | |||
| p-values | Alternative Hypothesis | ||
| breakpoint index | greater | 2-sided | less |
| 21 | 0.30299238139651 | 0.60598476279302 | 0.69700761860349 |
| 22 | 0.188602494375657 | 0.377204988751313 | 0.811397505624343 |
| 23 | 0.127381706422838 | 0.254763412845677 | 0.872618293577162 |
| 24 | 0.145455893983202 | 0.290911787966404 | 0.854544106016798 |
| 25 | 0.0988623013466604 | 0.197724602693321 | 0.90113769865334 |
| 26 | 0.560425227352294 | 0.879149545295412 | 0.439574772647706 |
| 27 | 0.684016840304894 | 0.631966319390212 | 0.315983159695106 |
| 28 | 0.763017441054194 | 0.473965117891612 | 0.236982558945806 |
| 29 | 0.805051604310914 | 0.389896791378172 | 0.194948395689086 |
| 30 | 0.717187415728589 | 0.565625168542822 | 0.282812584271411 |
| 31 | 0.635143324167674 | 0.729713351664651 | 0.364856675832326 |
| 32 | 0.594351743316717 | 0.811296513366566 | 0.405648256683283 |
| 33 | 0.670698194771754 | 0.658603610456493 | 0.329301805228246 |
| 34 | 0.908981177926782 | 0.182037644146437 | 0.0910188220732183 |
| 35 | 0.914695650768441 | 0.170608698463118 | 0.085304349231559 |
| 36 | 0.91979165038678 | 0.16041669922644 | 0.08020834961322 |
| 37 | 0.87022671042163 | 0.259546579156741 | 0.129773289578371 |
| 38 | 0.816599734799673 | 0.366800530400654 | 0.183400265200327 |
| 39 | 0.685955294993127 | 0.628089410013746 | 0.314044705006873 |
| 40 | 0.675753780303632 | 0.648492439392737 | 0.324246219696368 |
| Meta Analysis of Goldfeld-Quandt test for Heteroskedasticity | |||
| Description | # significant tests | % significant tests | OK/NOK |
| 1% type I error level | 0 | 0 | OK |
| 5% type I error level | 0 | 0 | OK |
| 10% type I error level | 0 | 0 | OK |